
Lecture EWEA 2000 - Slide 18: Unterschied zwischen den Versionen
Aus Transnational-Renewables
(Die Seite wurde neu angelegt: „{{Slide|Wp21-slide|en|18}}“) |
|||
| Zeile 1: | Zeile 1: | ||
{{Slide|Wp21-slide|en|18}} | {{Slide|Wp21-slide|en|18}} | ||
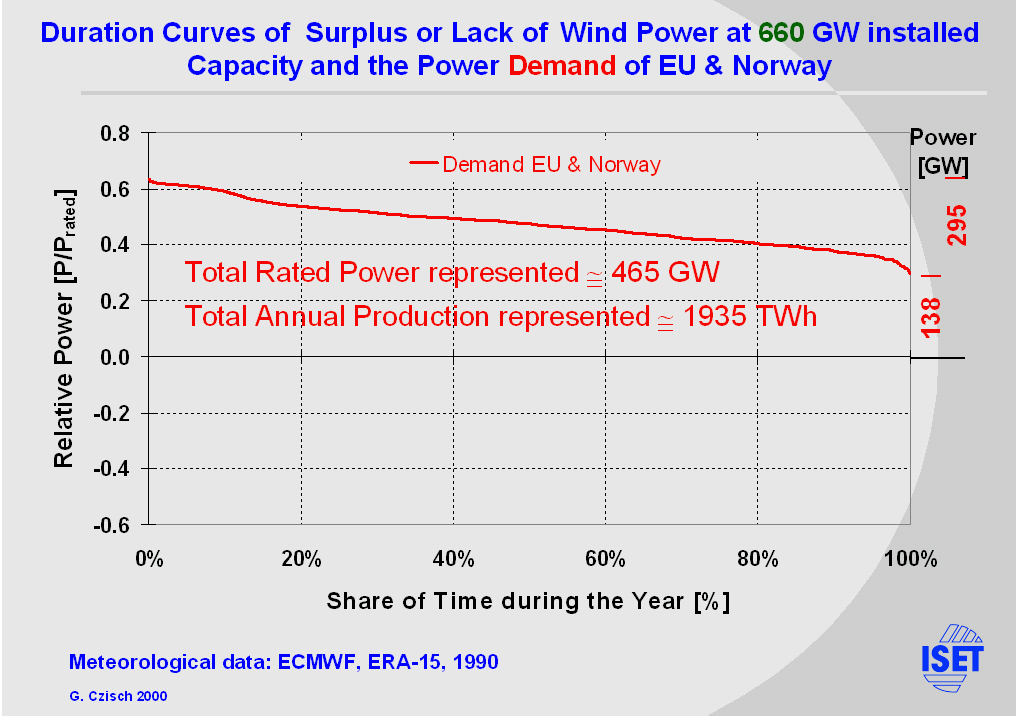
| + | Now let us consider we produce the equivalent of the demand from wind energy. | ||
| + | For the demand in EU & Norway we need to install 660 GW within all regions. | ||
| + | |||
| + | First there is the duration curve of the demand printed on the slide. It represents a total rated power of 465 GW and a demand of 1940 TWh. | ||
| + | The maximum power demand is 295 GW the minimum about 140 GW. | ||
Aktuelle Version vom 3. Oktober 2010, 16:51 Uhr
| Lecture Magdeburg [2001,en], Vortrag Lübeck [2006,de], Lecture Barcelona [2008,en], Vortrag EWEA 2000 [2000,en] |
| Vorstellung regenerativer Energien: Biomasse, Windenergie, Fallwindkraftwerke, Geothermie, Wasserkraft, Solarenergie |
|
Overview
|

|

Now let us consider we produce the equivalent of the demand from wind energy. For the demand in EU & Norway we need to install 660 GW within all regions.
First there is the duration curve of the demand printed on the slide. It represents a total rated power of 465 GW and a demand of 1940 TWh. The maximum power demand is 295 GW the minimum about 140 GW.