
Lecture Magdeburg 2001 - Slide 11: Unterschied zwischen den Versionen
Aus Transnational-Renewables
(Die Seite wurde neu angelegt: „{{Slide|VM2001_slide|en|11}}“) |
|||
| Zeile 1: | Zeile 1: | ||
{{Slide|VM2001_slide|en|11}} | {{Slide|VM2001_slide|en|11}} | ||
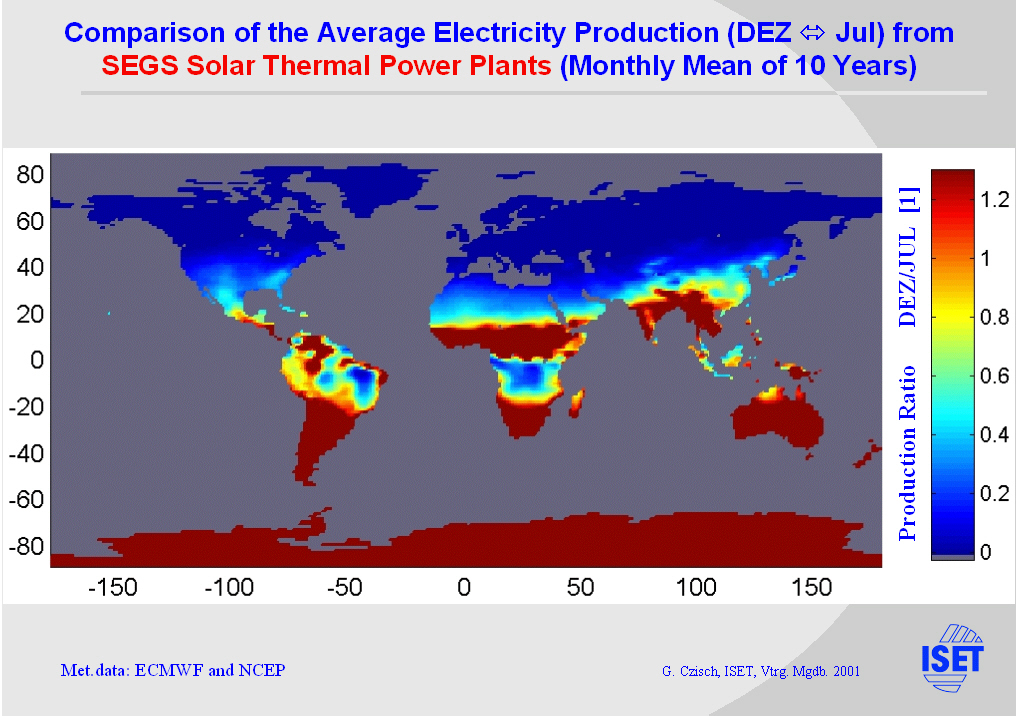
| + | The monthly variation of power production from SEGS power plants can be studied in more detail comparing the different graphs on this slide. They show monthly averages for selected regions contrasted with the electricity consumption of the member states of the EU. | ||
Aktuelle Version vom 5. August 2010, 23:08 Uhr
| Lecture Magdeburg [2001,en], Vortrag Lübeck [2006,de], Lecture Barcelona [2008,en], Vortrag EWEA 2000 [2000,en] |
| Vorstellung regenerativer Energien: Biomasse, Windenergie, Fallwindkraftwerke, Geothermie, Wasserkraft, Solarenergie |
|
Overview
|
|

The monthly variation of power production from SEGS power plants can be studied in more detail comparing the different graphs on this slide. They show monthly averages for selected regions contrasted with the electricity consumption of the member states of the EU.