
Vortrag Lübeck 2006 - Übersicht: Unterschied zwischen den Versionen
Aus Transnational-Renewables
| Zeile 50: | Zeile 50: | ||
|- | |- | ||
|[[Datei:LB2006-slide9.jpg|200px|verweis=Vortrag Lübeck 2006 - Folie 9]] | |[[Datei:LB2006-slide9.jpg|200px|verweis=Vortrag Lübeck 2006 - Folie 9]] | ||
| − | | | + | |Now we come to hydropower. |
| + | |||
| + | Here it is worth to distinguish between two types. | ||
| + | |||
| + | The river runoff type uses the water at the time it runs down the river and normally has no or just very little storage capacity. | ||
| + | |||
| + | The storage type sometimes can store the water which is running into its reservoir for many months (see following table). So this kind of power plant decouples runoff and electricity production and thus gives the degrees of freedom necessary to be used as back up to balance the variation of other production facilities and of the demand. | ||
|- | |- | ||
|[[Datei:LB2006-slide10.jpg|200px|verweis=Vortrag Lübeck 2006 - Folie 10]] | |[[Datei:LB2006-slide10.jpg|200px|verweis=Vortrag Lübeck 2006 - Folie 10]] | ||
| − | | | + | |This Table shows the rated power, the storage capacities and the annual energy production of Storage Hydroelectric Power Plants in Western European Countries. The storage capacities are close to 10% of the total electricity production within all the member countries of the EU-15. |
|- | |- | ||
|[[Datei:LB2006-slide11.jpg|200px|verweis=Vortrag Lübeck 2006 - Folie 11]] | |[[Datei:LB2006-slide11.jpg|200px|verweis=Vortrag Lübeck 2006 - Folie 11]] | ||
| − | | | + | |The best hydropower potentials are found in mountainous regions with high annual precipitation. |
|- | |- | ||
|[[Datei:LB2006-slide12.jpg|200px|verweis=Vortrag Lübeck 2006 - Folie 12]] | |[[Datei:LB2006-slide12.jpg|200px|verweis=Vortrag Lübeck 2006 - Folie 12]] | ||
| − | | | + | |Especially the industrial countries already use a considerable part of their hydropower potentials. |
| + | |||
| + | At Inga at the river Congo there is probably the location where the biggest hydropower plant world wide could be erected. | ||
|- | |- | ||
|[[Datei:LB2006-slide13.jpg|200px|verweis=Vortrag Lübeck 2006 - Folie 13]] | |[[Datei:LB2006-slide13.jpg|200px|verweis=Vortrag Lübeck 2006 - Folie 13]] | ||
| − | | | + | |Now we come to wind energy. |
|- | |- | ||
|[[Datei:LB2006-slide14.jpg|200px|verweis=Vortrag Lübeck 2006 - Folie 14]] | |[[Datei:LB2006-slide14.jpg|200px|verweis=Vortrag Lübeck 2006 - Folie 14]] | ||
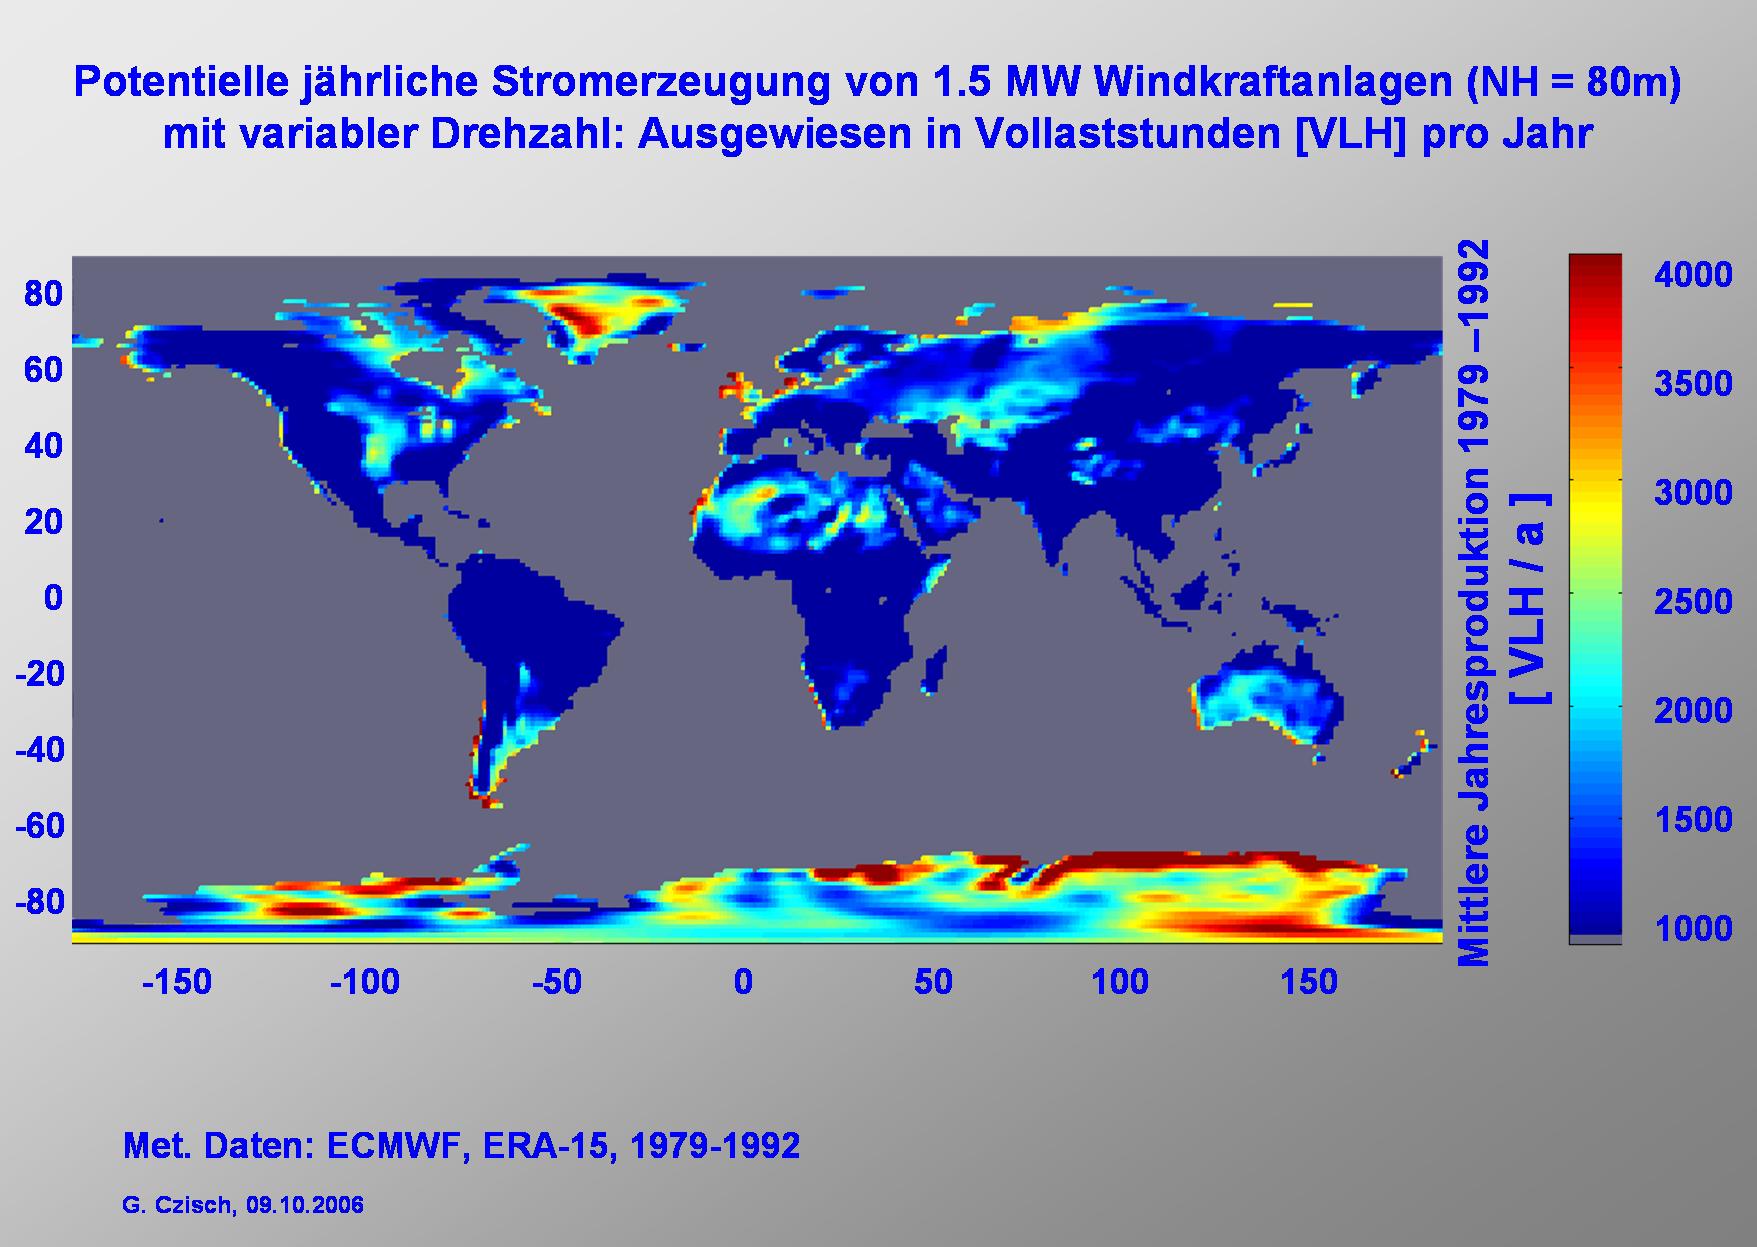
| − | | | + | |Here you can see the potential production of wind energy calculated from Data of the European Centre for Medium Range Weather Forecast expressed in FLH. Europe itself has good wind conditions. But its use is limited by the high population density. In a belt 4000 to 5000 km away from Kassel which is right in the middle of Germany there are also very good wind conditions and in most of the areas the population density is 2 orders of magnitude smaller than for example in Germany. |
|- | |- | ||
|[[Datei:LB2006-slide15.jpg|200px|verweis=Vortrag Lübeck 2006 - Folie 15]] | |[[Datei:LB2006-slide15.jpg|200px|verweis=Vortrag Lübeck 2006 - Folie 15]] | ||
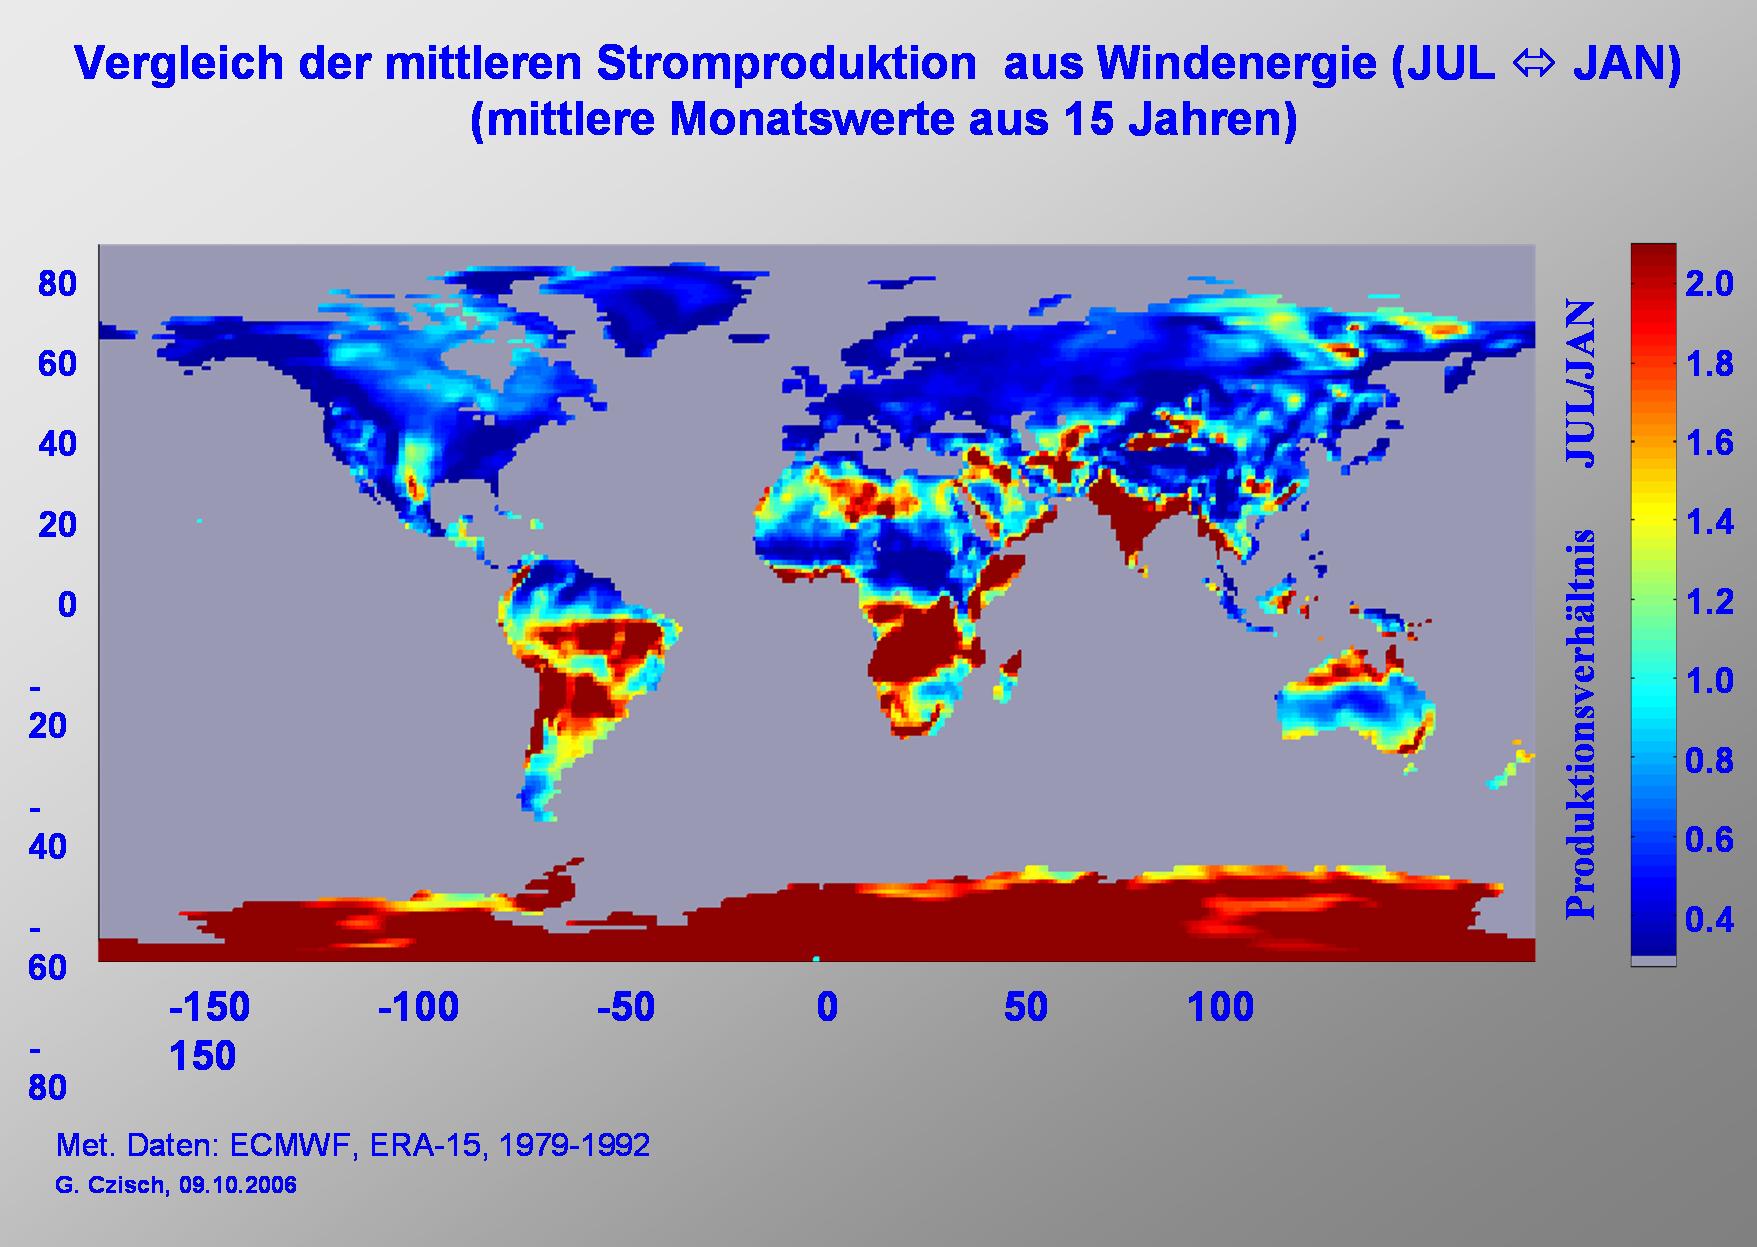
| − | | | + | |The seasonal variation of the potential power production from wind energy shows significant differences in different regions.��On this slide you can see for example the ratio between the average electricity production in July and January.��We see, that Europe is a typical winter wind region with maxima in winter and minima in summer. While for example at the Saharan west coast we find maxima of the production in summer. In some other regions the production in July and January are quite similar. So the idea of selecting the regions in order to get the best match of production and electricity consumption suggests itself. |
|- | |- | ||
|[[Datei:LB2006-slide16.jpg|200px|verweis=Vortrag Lübeck 2006 - Folie 16]] | |[[Datei:LB2006-slide16.jpg|200px|verweis=Vortrag Lübeck 2006 - Folie 16]] | ||
| − | | | + | |If we now zoom in and have a view on Europe and its neighbourhood we find the potential production within the shown area only considering Sites with more than 1500 FLH (this is about 40% of the land area shown) is about 100 times higher than the Need of the European Union and Norway or 50 times the electricity consumption of the whole area. (If the best wind sites within the area – according to the ECMWF data used – would be selected till the annual production is equivalent to the annual electricity consumption in the area shown there must be installed wind energy converters (WEC) at roughly 0.4% of the land area shown. About 1% of this area or 0.004% of the total area would then be covered by streets and other infrastructure for the WECs. This is a relatively small fraction it compared e.g. with the area used for different kinds of infrastructure today. In Germany the fraction is about 6% of the total land area which is about 1500 times as much.) |
| + | |||
| + | It is possible to be quite selective and choose only the better regions. As an example I selected the following. | ||
| + | # Good wind sites within EU & Norway. (With restrictions due to the high population density.) | ||
| + | # The Jamal Region with northern Russia. | ||
| + | # Parts of Kazakhstan | ||
| + | # Southern Morocco (The calculated production is rather conservative. Due to measurements in this region significantly higher production up to 5000 FLH is expected.) | ||
| + | # Mauritania also has good wind conditions. | ||
| + | |||
| + | To use these potentials we have to have high transport capacities. | ||
|- | |- | ||
|[[Datei:LB2006-slide17.jpg|200px|verweis=Vortrag Lübeck 2006 - Folie 17]] | |[[Datei:LB2006-slide17.jpg|200px|verweis=Vortrag Lübeck 2006 - Folie 17]] | ||
| − | | | + | |Now we look closer to the five selected regions. |
| + | |||
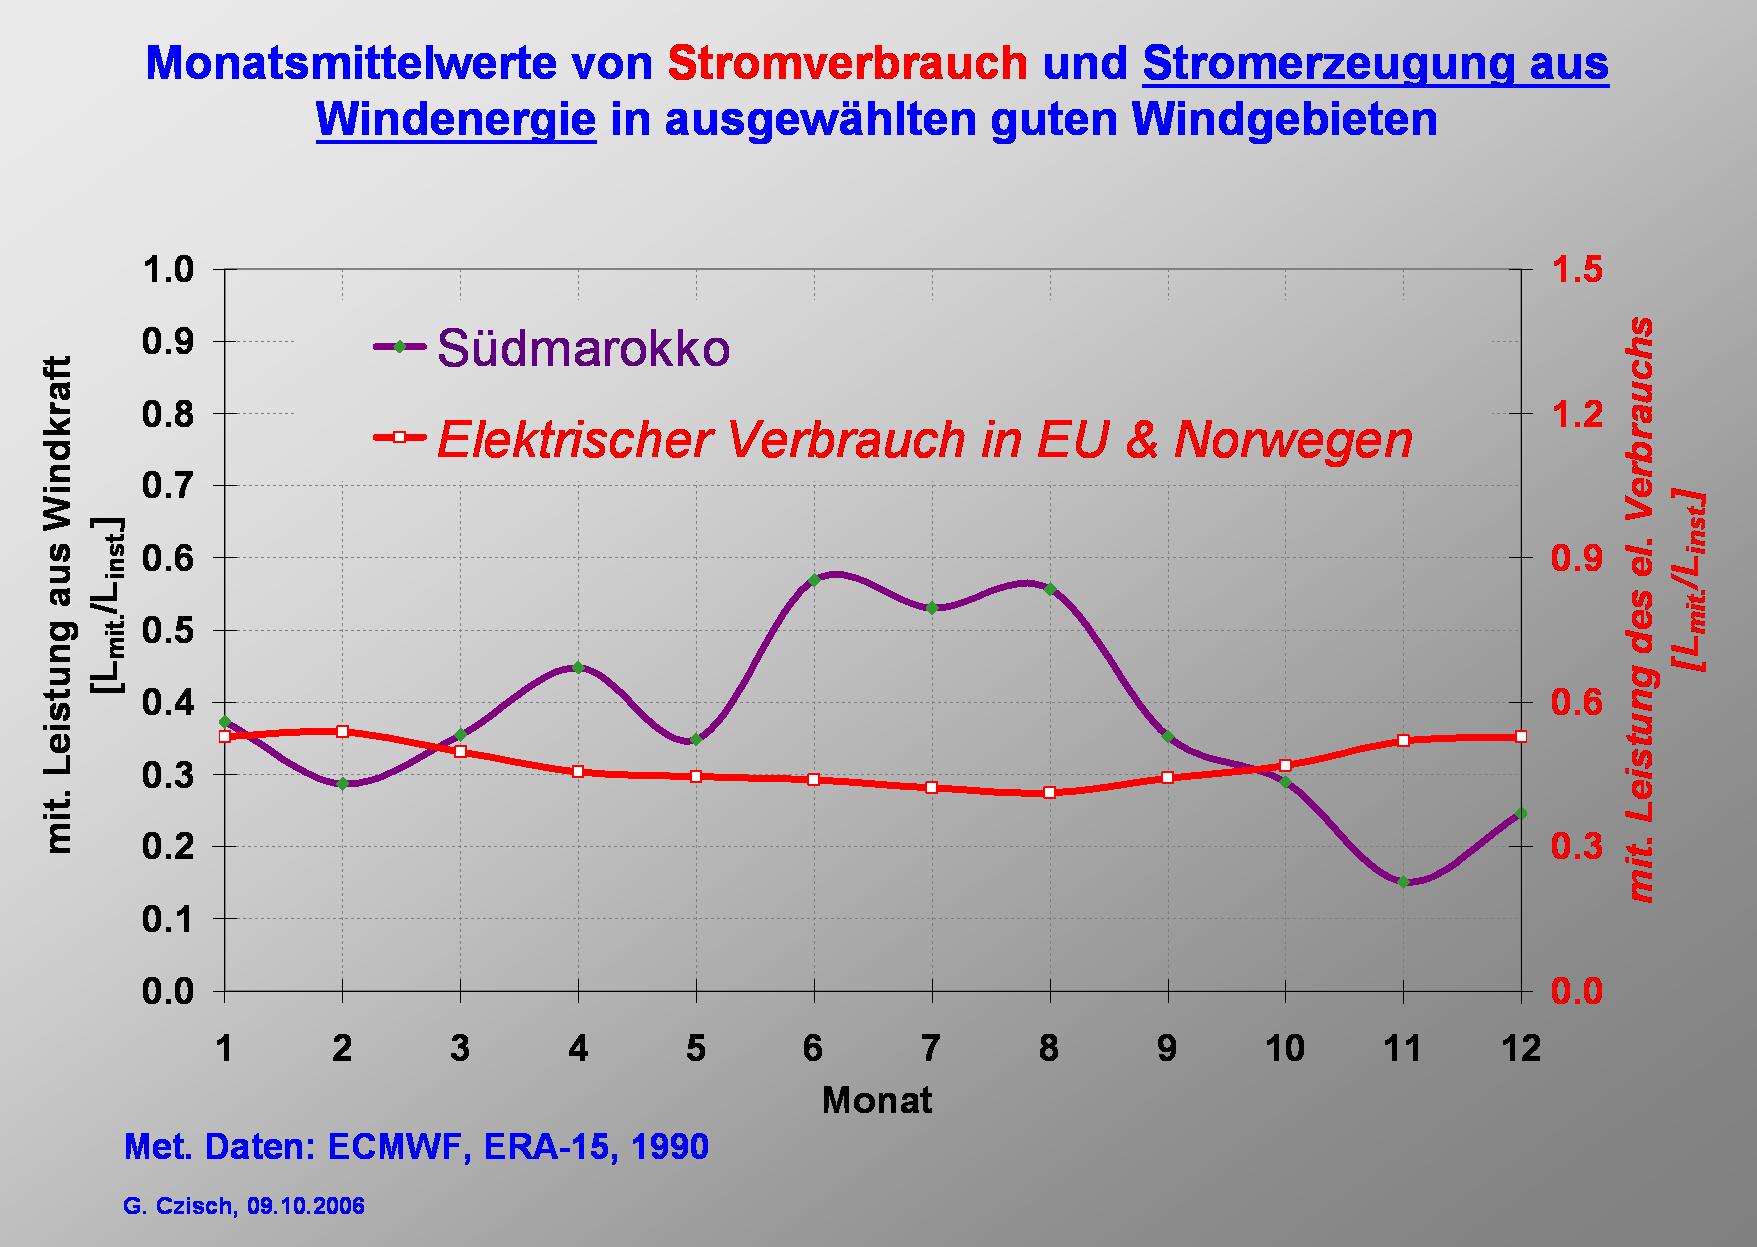
| + | Comparing the monthly mean wind power of the selected European regions and the Demand of the EU & Norway one can see that the fluctuations of the production varies much more than the demand. Europe is a typical winter wind region with maxima in winter and minima in the summer month. | ||
|- | |- | ||
|[[Datei:LB2006-slide18.jpg|200px|verweis=Vortrag Lübeck 2006 - Folie 18]] | |[[Datei:LB2006-slide18.jpg|200px|verweis=Vortrag Lübeck 2006 - Folie 18]] | ||
| − | | | + | |Also the monthly means in Southern Morocco vary much more than the demand, but it is a passat wind region with summer maxima. |
|- | |- | ||
|[[Datei:LB2006-slide19.jpg|200px|verweis=Vortrag Lübeck 2006 - Folie 19]] | |[[Datei:LB2006-slide19.jpg|200px|verweis=Vortrag Lübeck 2006 - Folie 19]] | ||
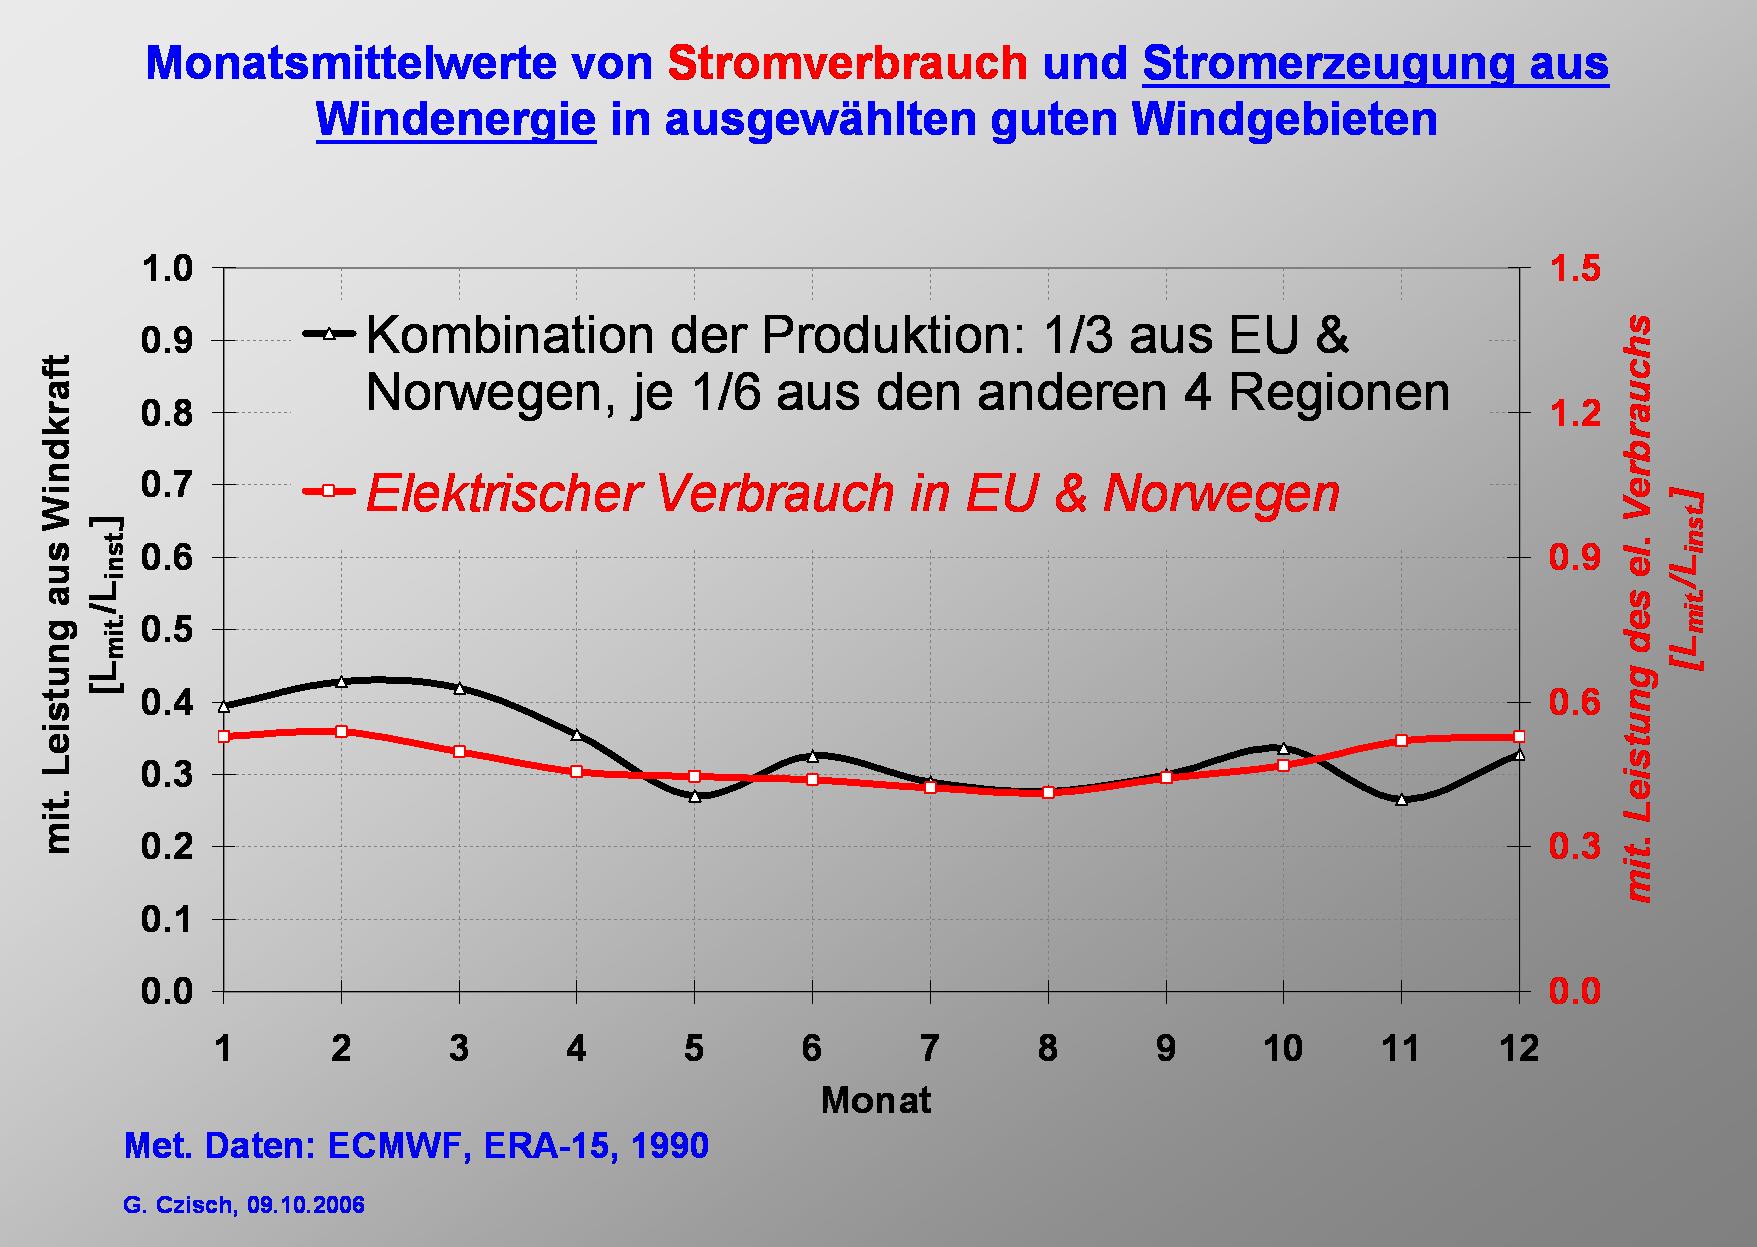
| − | | | + | |It is obvious that the use of simultaneous production in different regions can much better fit the demand. |
| + | This shows the black line which represents a combination of of the five selected regions. | ||
| + | |||
| + | But not only the long term behaviour changes with the size and selection of the catchment area. | ||
| + | |||
| + | Now let us consider we produce the equivalent of the demand from wind Energy. | ||
| + | |||
| + | For the demand EU & Norway we need to install 660 GW to within all regions. | ||
|- | |- | ||
|[[Datei:LB2006-slide20.jpg|200px|verweis=Vortrag Lübeck 2006 - Folie 20]] | |[[Datei:LB2006-slide20.jpg|200px|verweis=Vortrag Lübeck 2006 - Folie 20]] | ||
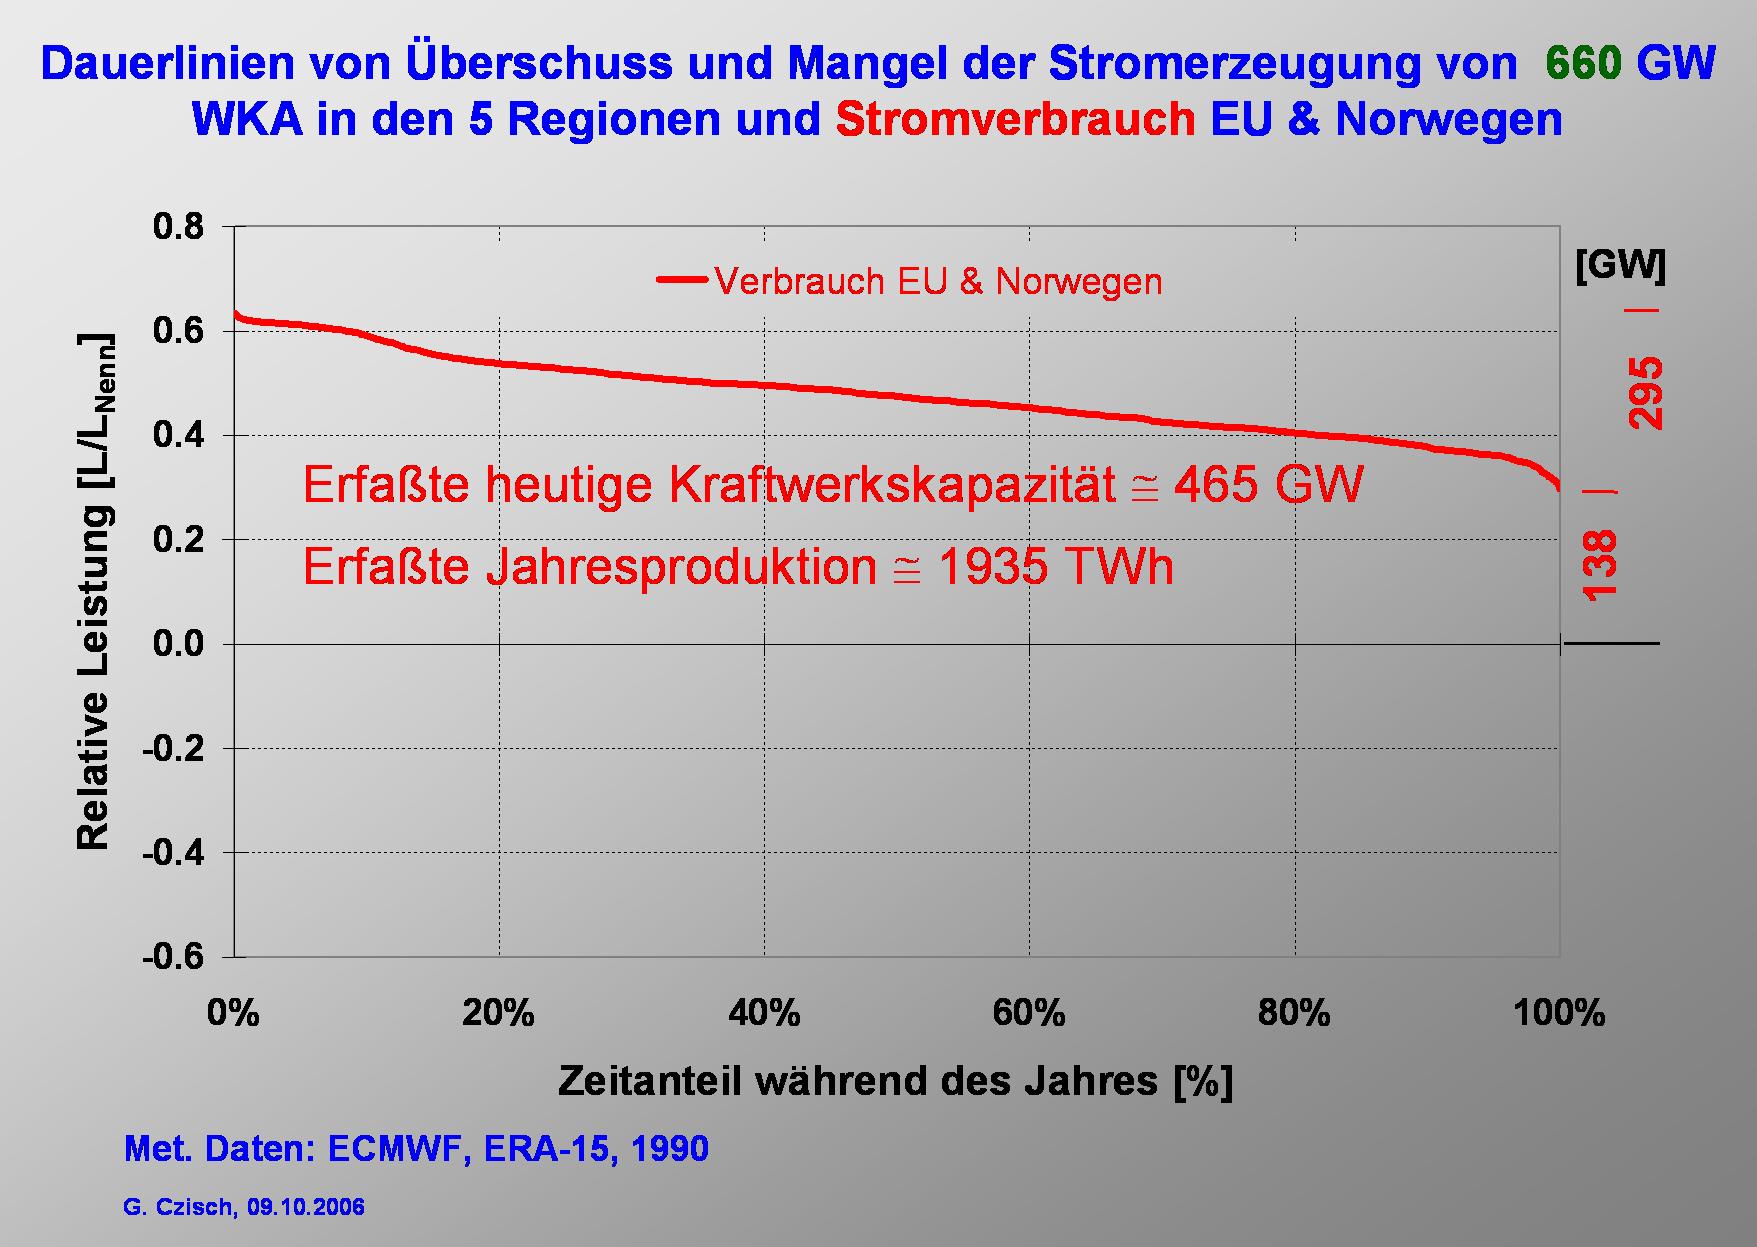
| − | | | + | |Following this simple example I would like to illustrate the influence of a combined production of electricity at the selected 5 regions shown before. |
| + | |||
| + | The duration curve of the hourly electricity consumption depicted in the slide represents a total rated power of 465 GW and a demand of 1940 TWh. The maximum power demand is 295 GW, the minimum about 140 GW. | ||
|- | |- | ||
|[[Datei:LB2006-slide21.jpg|200px|verweis=Vortrag Lübeck 2006 - Folie 21]] | |[[Datei:LB2006-slide21.jpg|200px|verweis=Vortrag Lübeck 2006 - Folie 21]] | ||
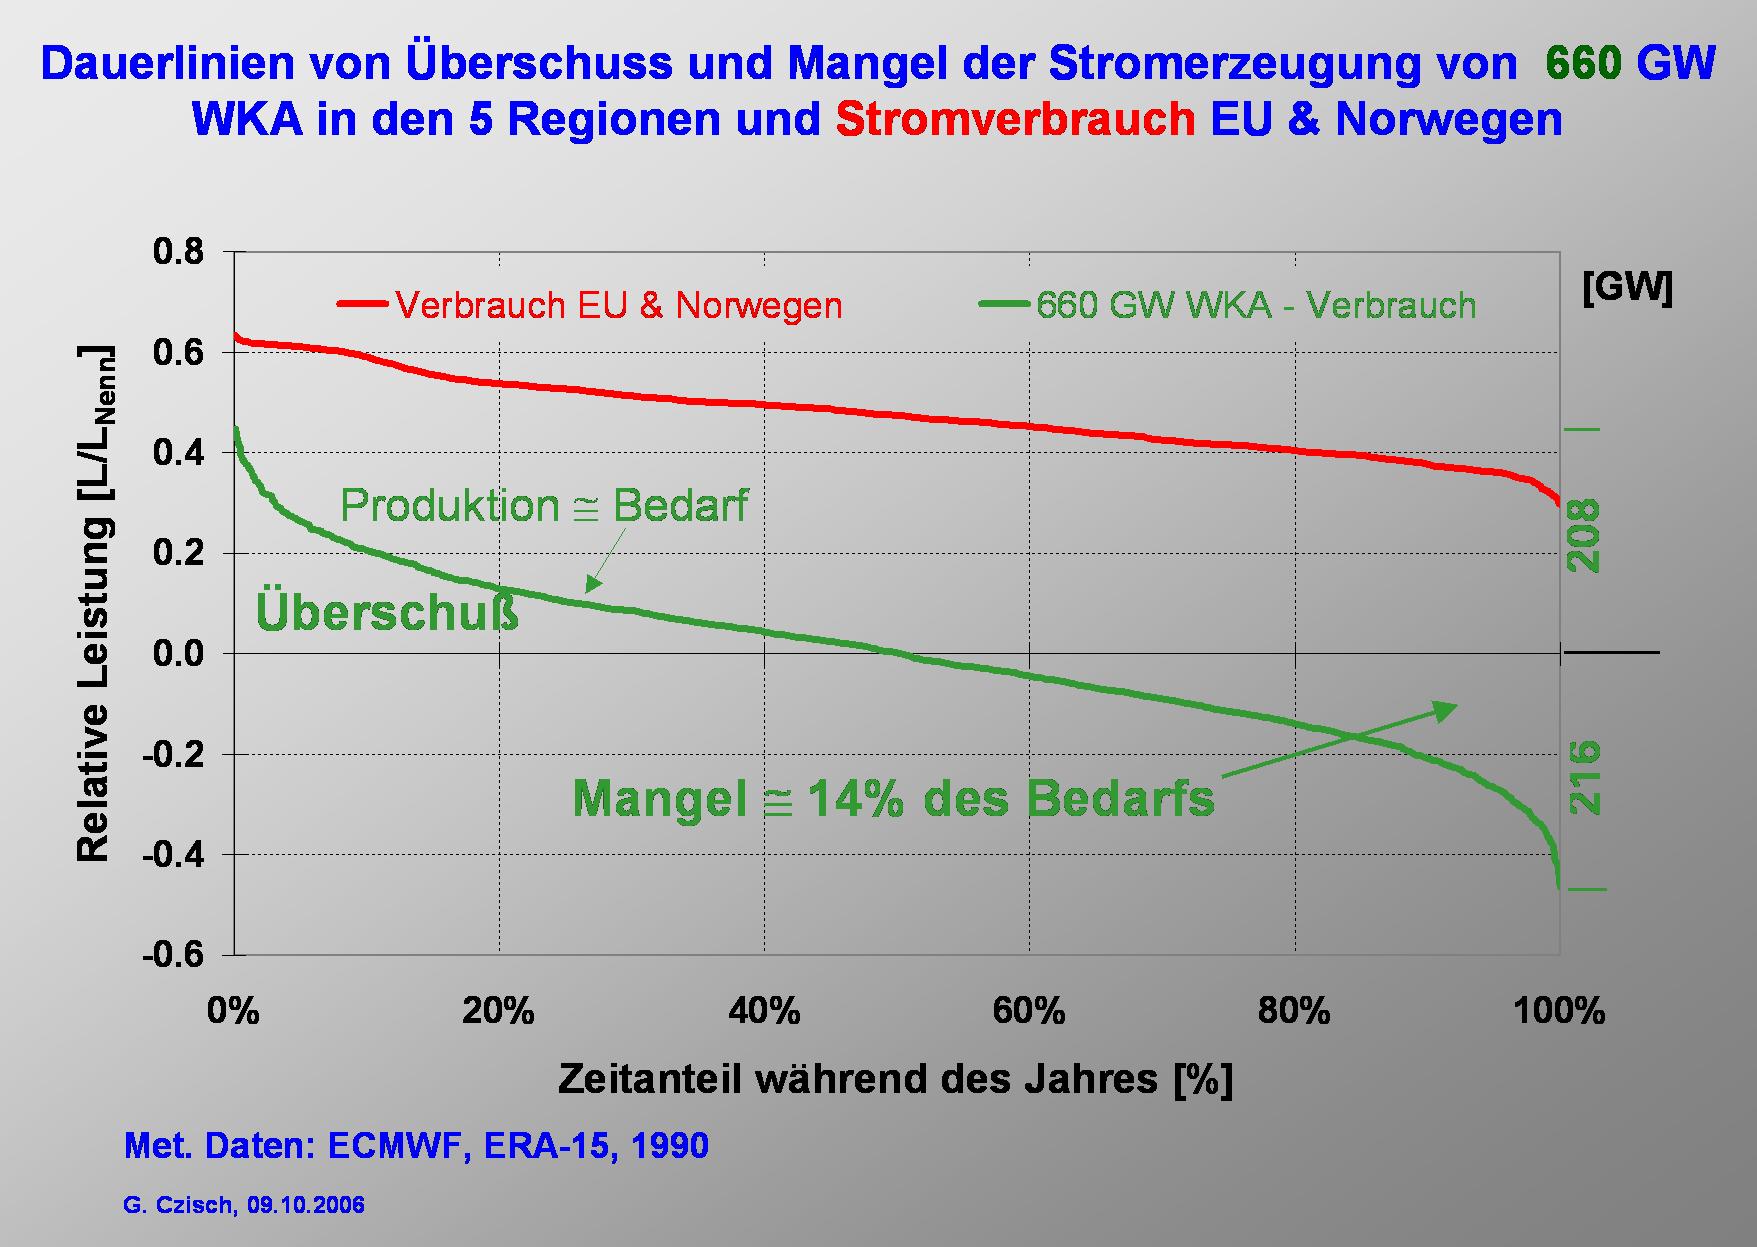
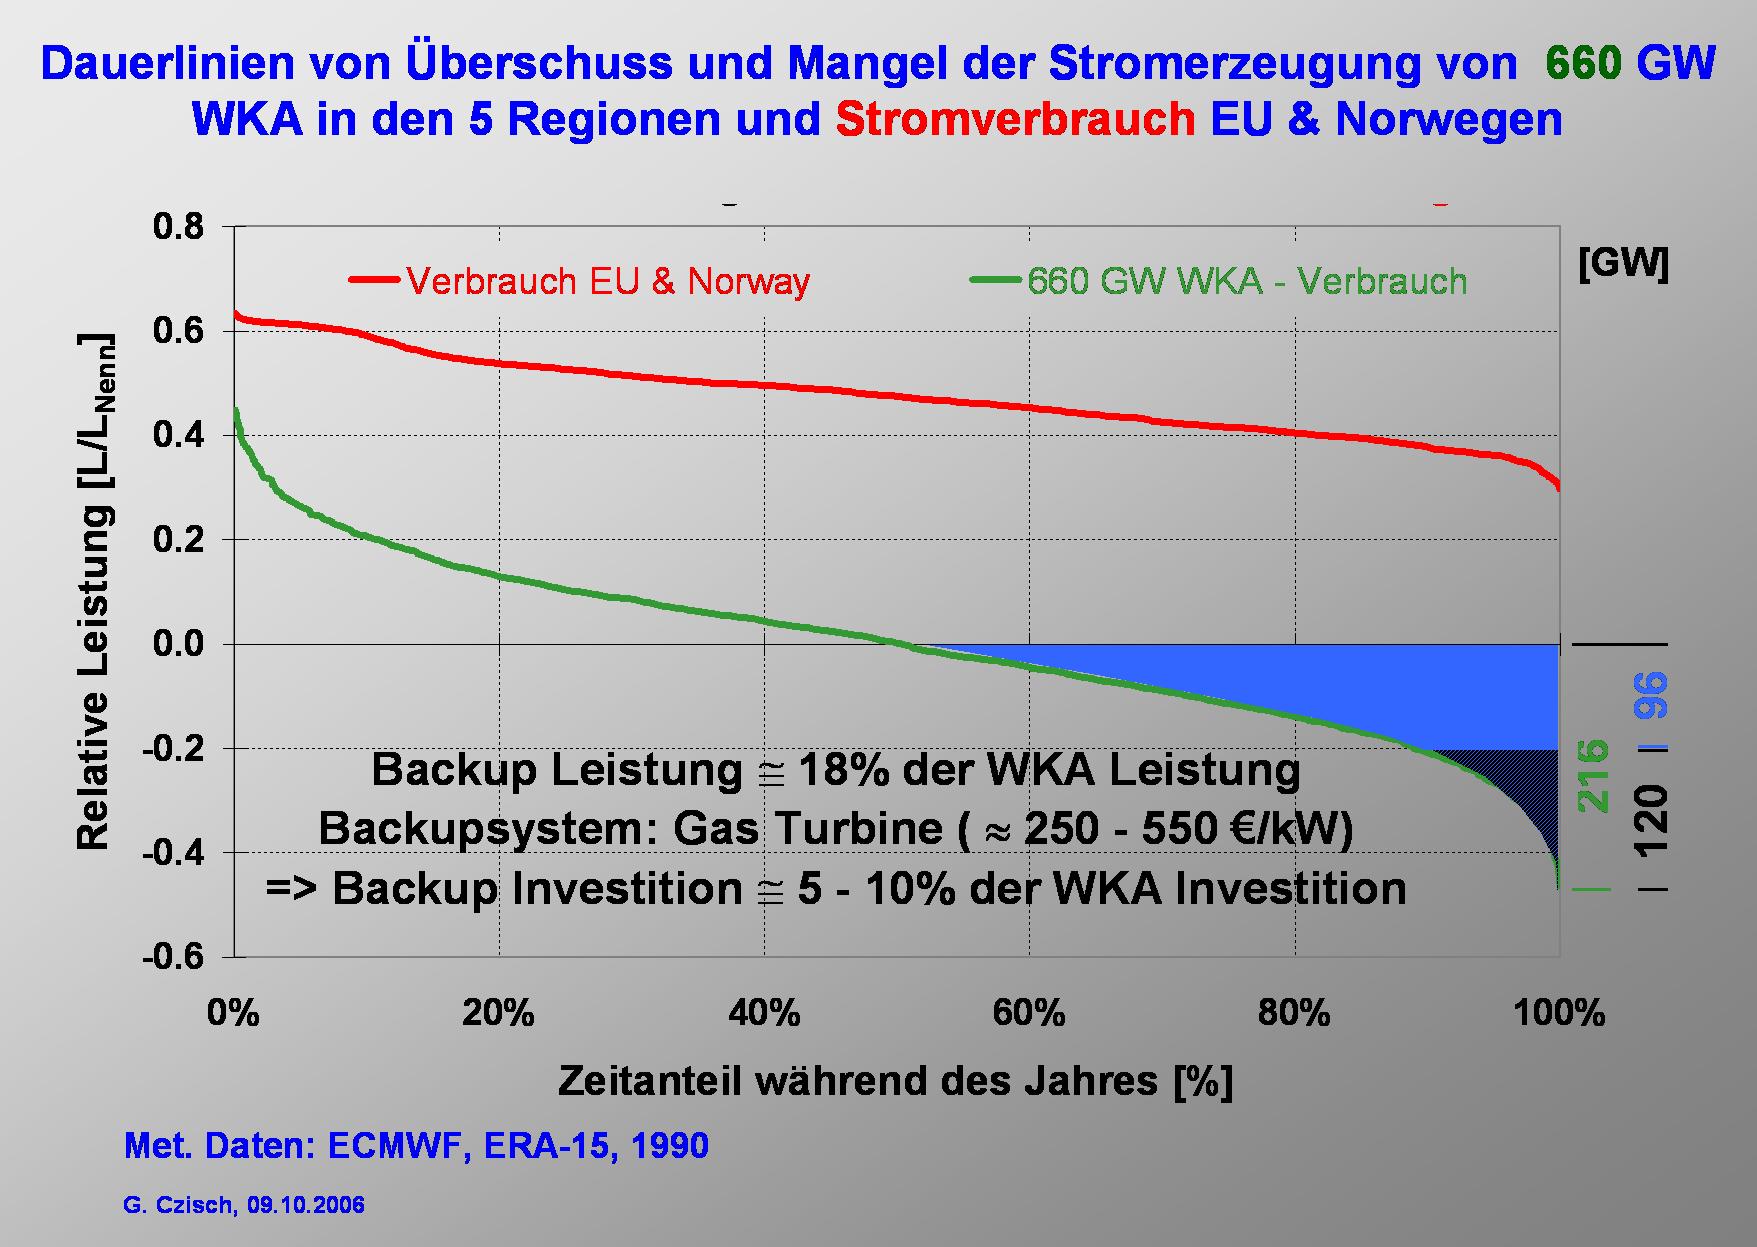
| − | | | + | |Now we ask the question: What happens if we produce as much electricity from wind energy as the annual consumption. |
| + | |||
| + | The duration curve of the difference between wind power production and demand is shown in the green line. The maximum power surplus and lack are each roughly 200 GW. The lack of energy amounts to 14% of the demand. | ||
|- | |- | ||
|[[Datei:LB2006-slide22.jpg|200px|verweis=Vortrag Lübeck 2006 - Folie 22]] | |[[Datei:LB2006-slide22.jpg|200px|verweis=Vortrag Lübeck 2006 - Folie 22]] | ||
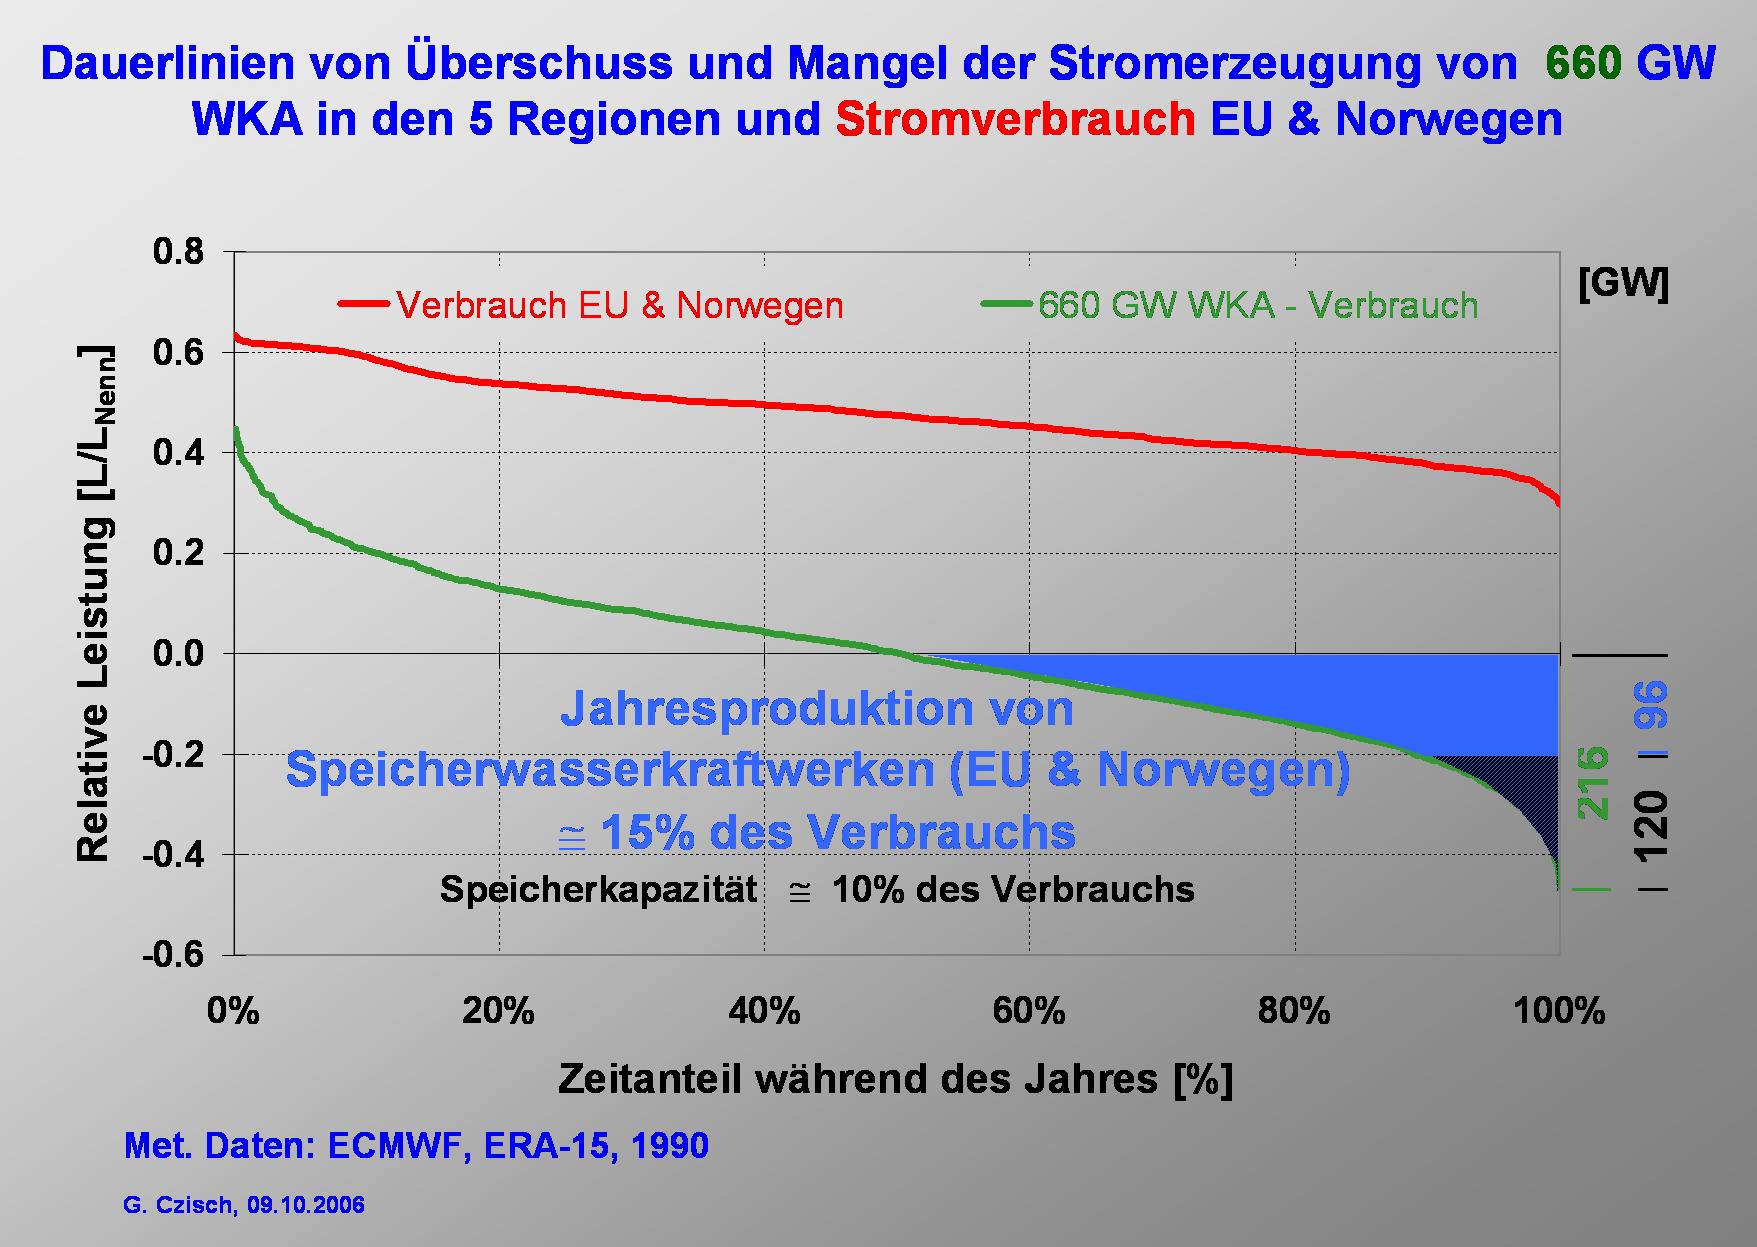
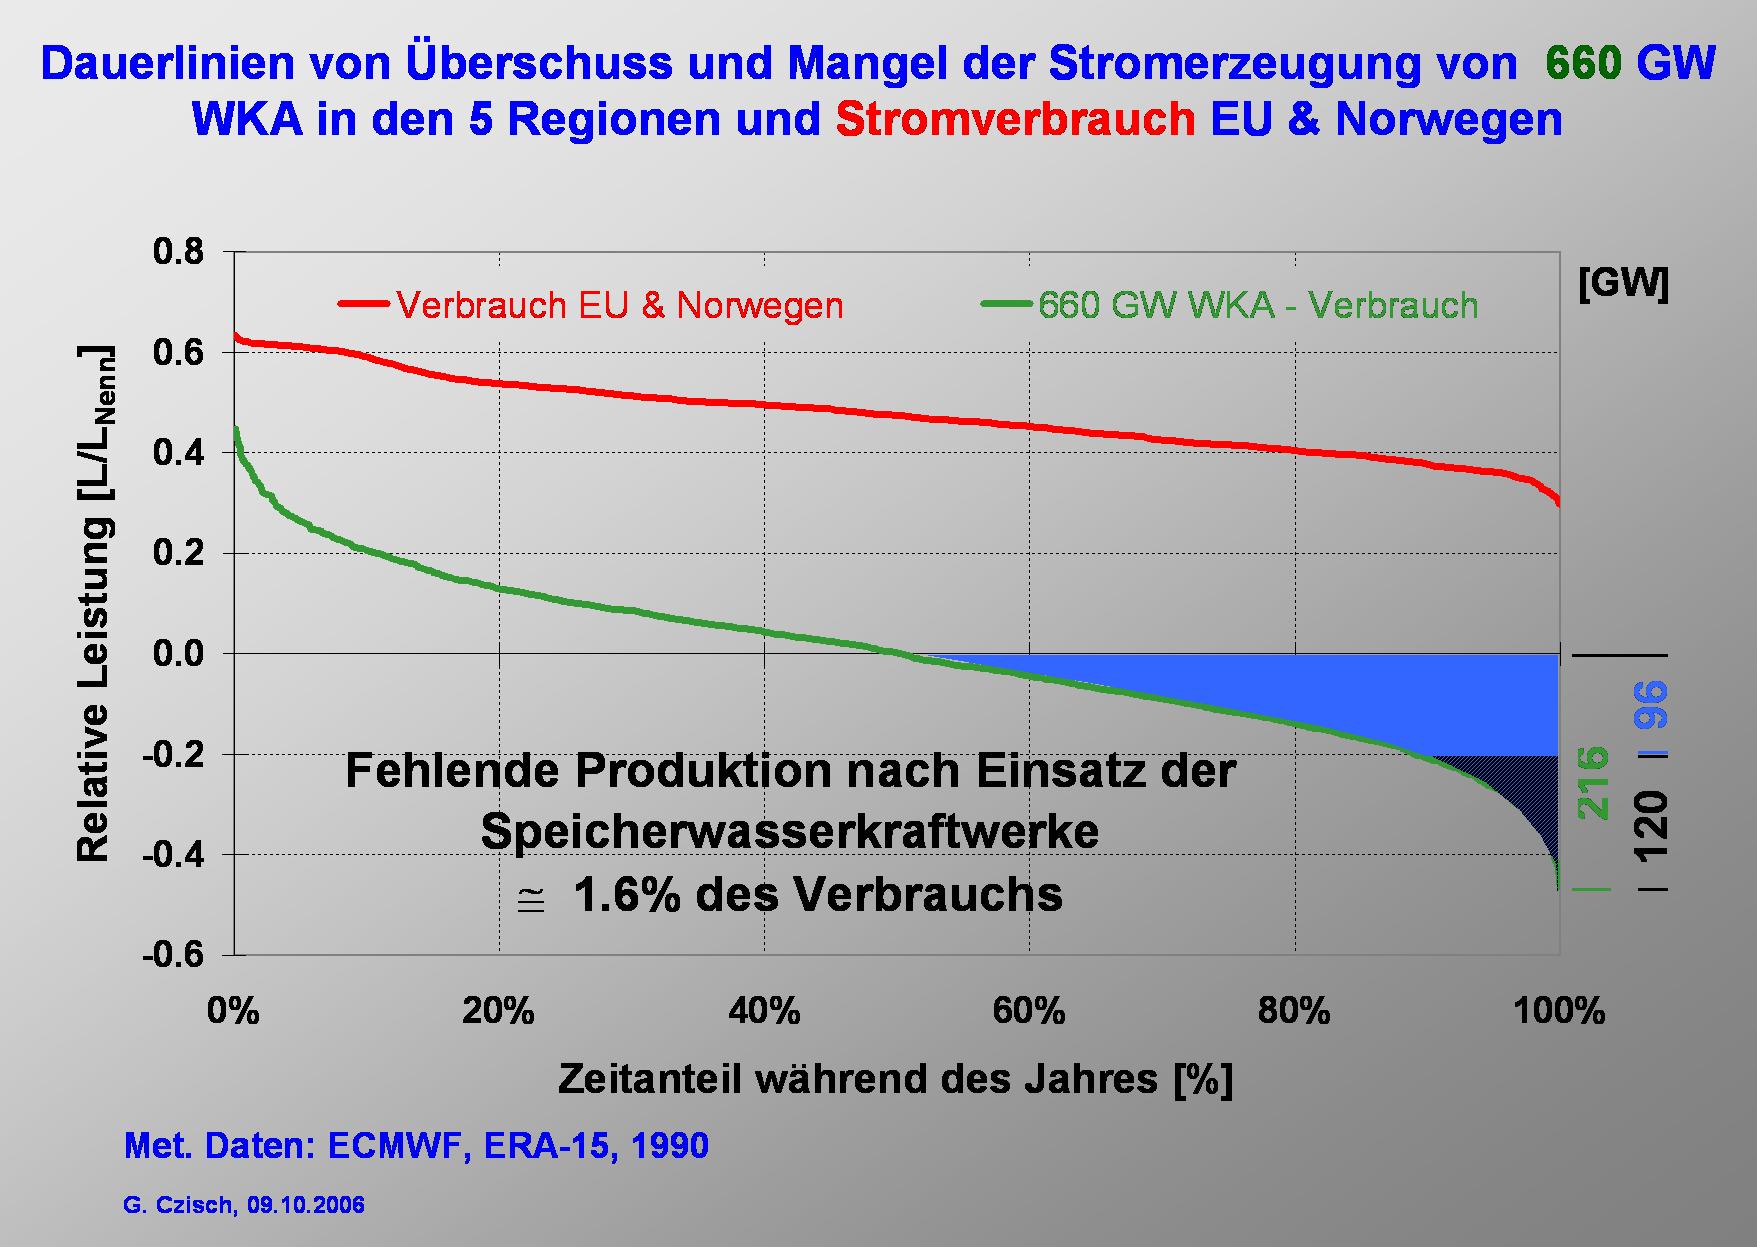
| − | | | + | |In Europe hydro power storage systems exist with relatively high rated power and storage capacities.��The annual production of the storage hydropower within our supply area is 15% of its demand. So it is slightly higher than the lack of energy from the considered wind power production and so more than enough to compensate the lack of energy.� |
|- | |- | ||
|[[Datei:LB2006-slide23.jpg|200px|verweis=Vortrag Lübeck 2006 - Folie 23]] | |[[Datei:LB2006-slide23.jpg|200px|verweis=Vortrag Lübeck 2006 - Folie 23]] | ||
Version vom 3. Oktober 2010, 12:13 Uhr
| Lecture Magdeburg [2001,en], Vortrag Lübeck [2006,de], Lecture Barcelona [2008,en], Vortrag EWEA 2000 [2000,en] |
| Vorstellung regenerativer Energien: Biomasse, Windenergie, Fallwindkraftwerke, Geothermie, Wasserkraft, Solarenergie |
Wirtschaftlich realisierbare Stromversorgung für Europa un seine Nachbarn
- diese Folien zeigen eindrucksvoll, die Möglichkeit regenerative Energien.....
|
I my talk I will show that we can produce all our electricity from renewable sources. This would have a high positive impact on climate protection since today nearly half of the CO2 emissions are caused by electricity production.
In my talk I will introduce you to some the worldwide potentials for renewable electricity production. The techniques we will discuss are electricity production via solar thermal power plants and hydropower and finally we will focus on wind energy. For each of these options of power generation I am going to point out the characteristics with regard to their specific temporal behaviour and the costs to be expected. We will see that the temporal behaviour significantly changes with the size and the selection of the catchment area used for the power generation. We will also touch on the topics of backup and storage needs, the subject of grid capacities and of cause the question of electricity costs. After this we will come to economically viable „Scenarios for a Future Electricity Supply“ * based 100% on renewable energies. It will be shown that a change to a totally renewable electricity supply is neither a technical nor a economic problem but mainly a political task.
Szenarien zur zukünftigen Stromversorgung - Kostenoptimierte Variationen zur Versorgung Europas und seiner Nachbarn mit Strom aus erneuerbaren Energien https://kobra.bibliothek.uni-kassel.de/handle/urn:nbn:de:hebis:34-200604119596 Low Cost but Totally Renewable Electricity Supply for a Huge Supply Area http://www.iset.uni-kassel.de/abt/w3-w/projekte/LowCostEuropElSup_revised_for_AKE_2006.pdf |
|
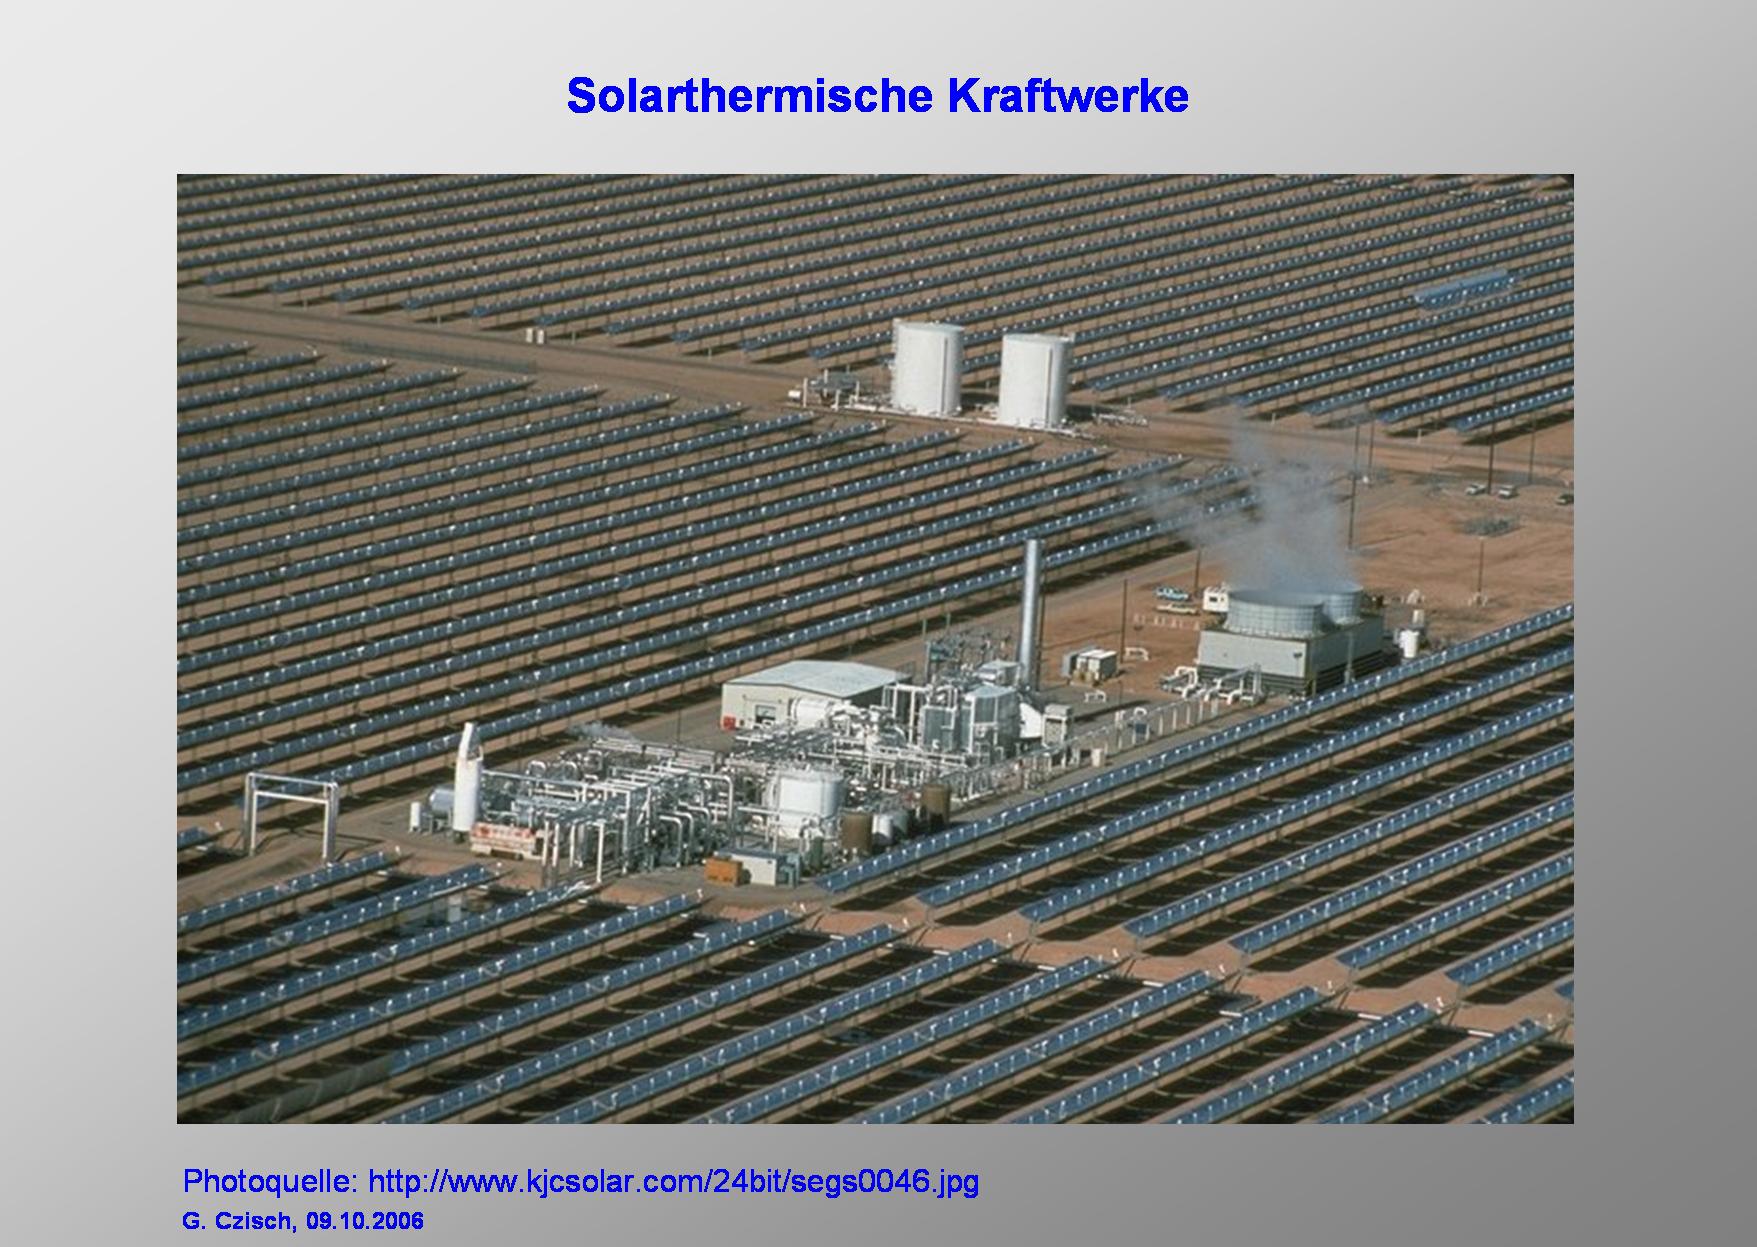
Here you see a view of a solar thermal power plant which leads us to the potentials of this kind of electricity production. The direct solar radiation is concentrated in parabolic troughs to heat up a fluid that is used to power a conventional thermal power plant. Dependent on the design of the power plant the heat is used with an efficiency between approx. 32 and 38 % to produce electricity. |
|
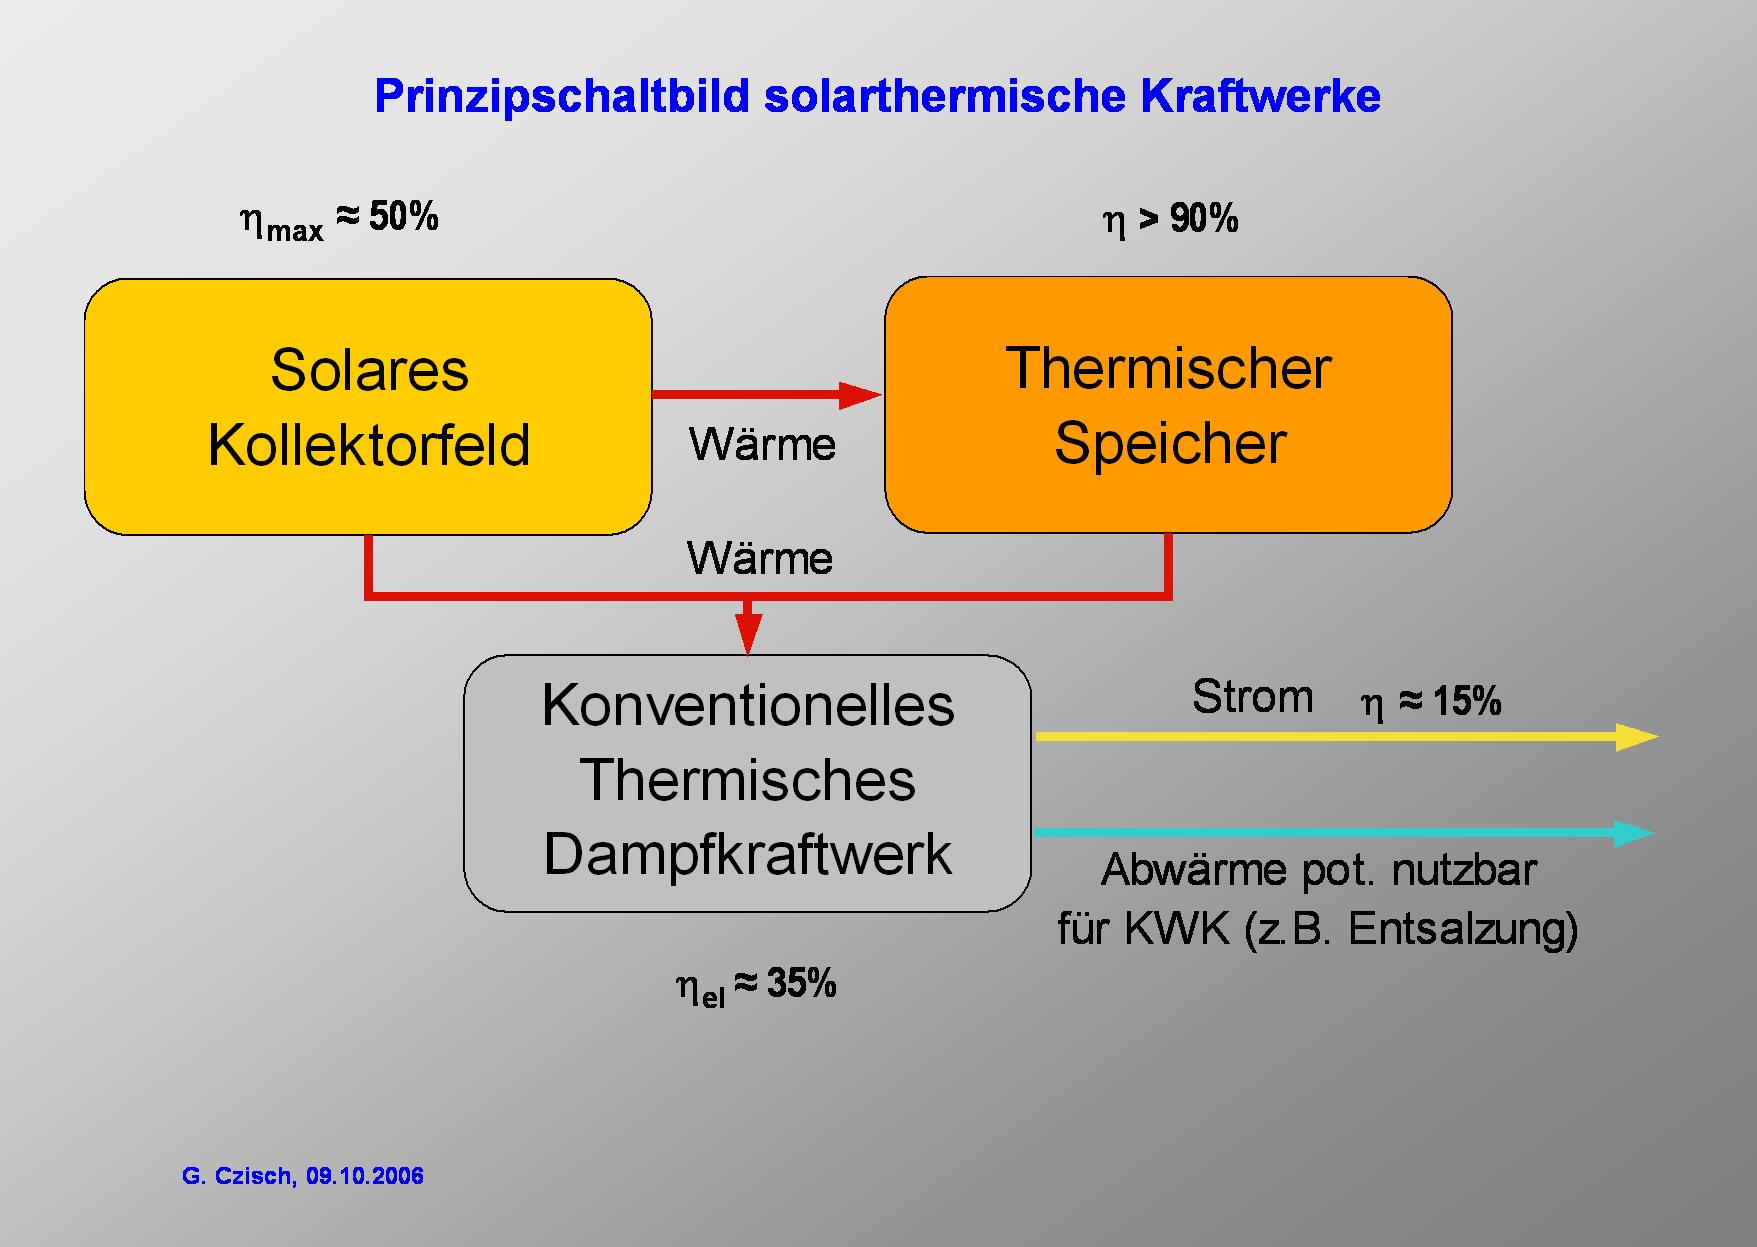
The solar heat can either directly be fed into the conventional thermal power plant or stored in a thermal storage to be used later (e.g. after sunset) to produce electricity. |

|
Here the potential heat production of the solar field of a SEGS power plant is shown. Very good conditions are found in the Sahara where the potential electricity production is more than 500 times the electricity consumption of the EU member states. |
|
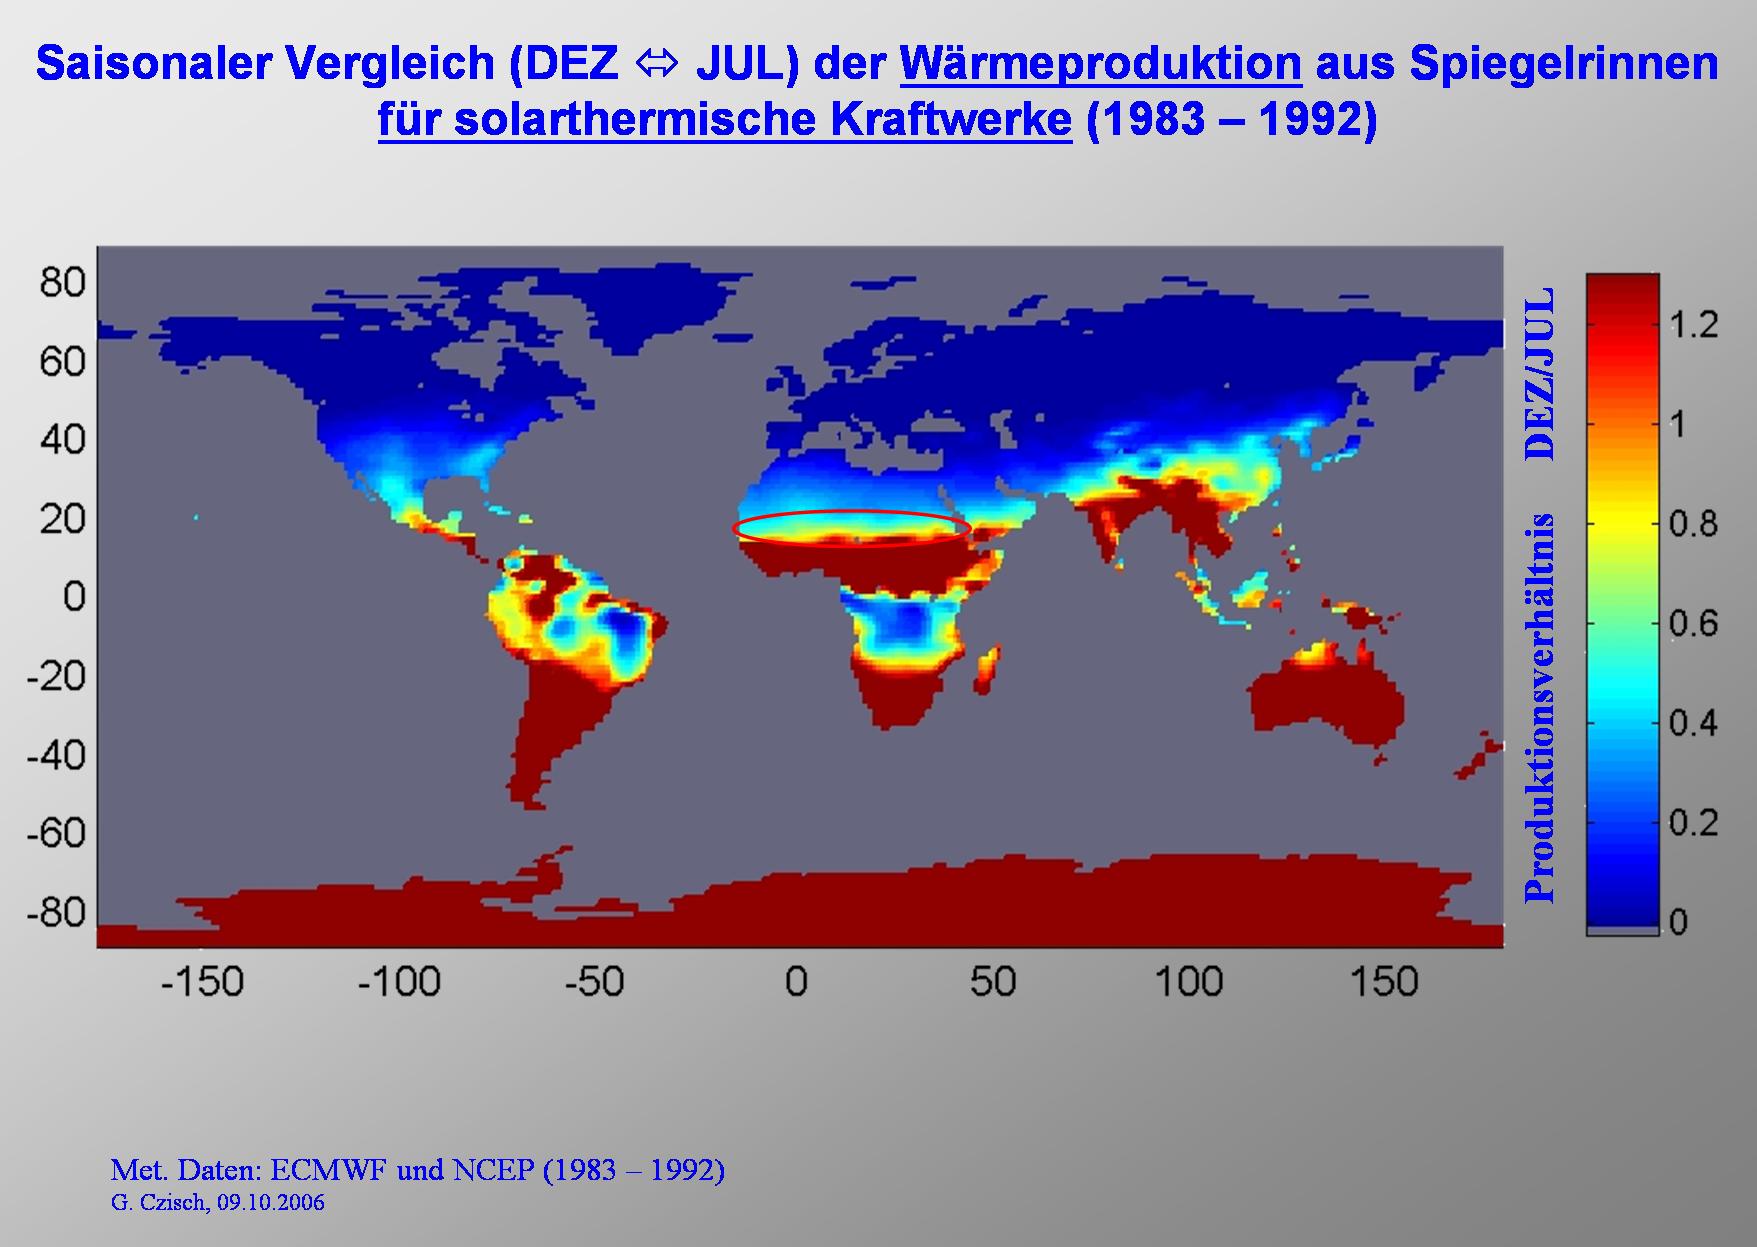
The seasonal variation of power production from SEGS power plants is significantly smaller at lower latitudes.
On this slide you can see for example the ratio between the average electricity production in December and July. As it is the case for the PV electricity production, at the southern Sahara we find that the production only changes slightly over the months while the variations increase much stronger going to higher longitudes. |

|
Since the electricity production with solar thermal power plants is – as we will see later – is relatively cheap at good sites we can also think at transmitting the electricity from Africa to Europe. |

|
But the European electricity network within and especially between the countries is to weak for high wind power penetration ore huge amounts of renewable electricity from solar thermal power plants. This is also true for the connection to Africa.
For example the Net Transfer Capacities from Morocco to Spain with its 400 MW and the 1100 MW from Spain to France would not allow high power transfer even if the capacity soon is enlarged to 1400 MW between Morocco and Spain. But there is a solution. High Voltage Direct Current Transmission (HVDC = HGÜ) is a technology used since many decades for transmission of huge amounts of electricity over far distances at very low losses and low costs. |

|
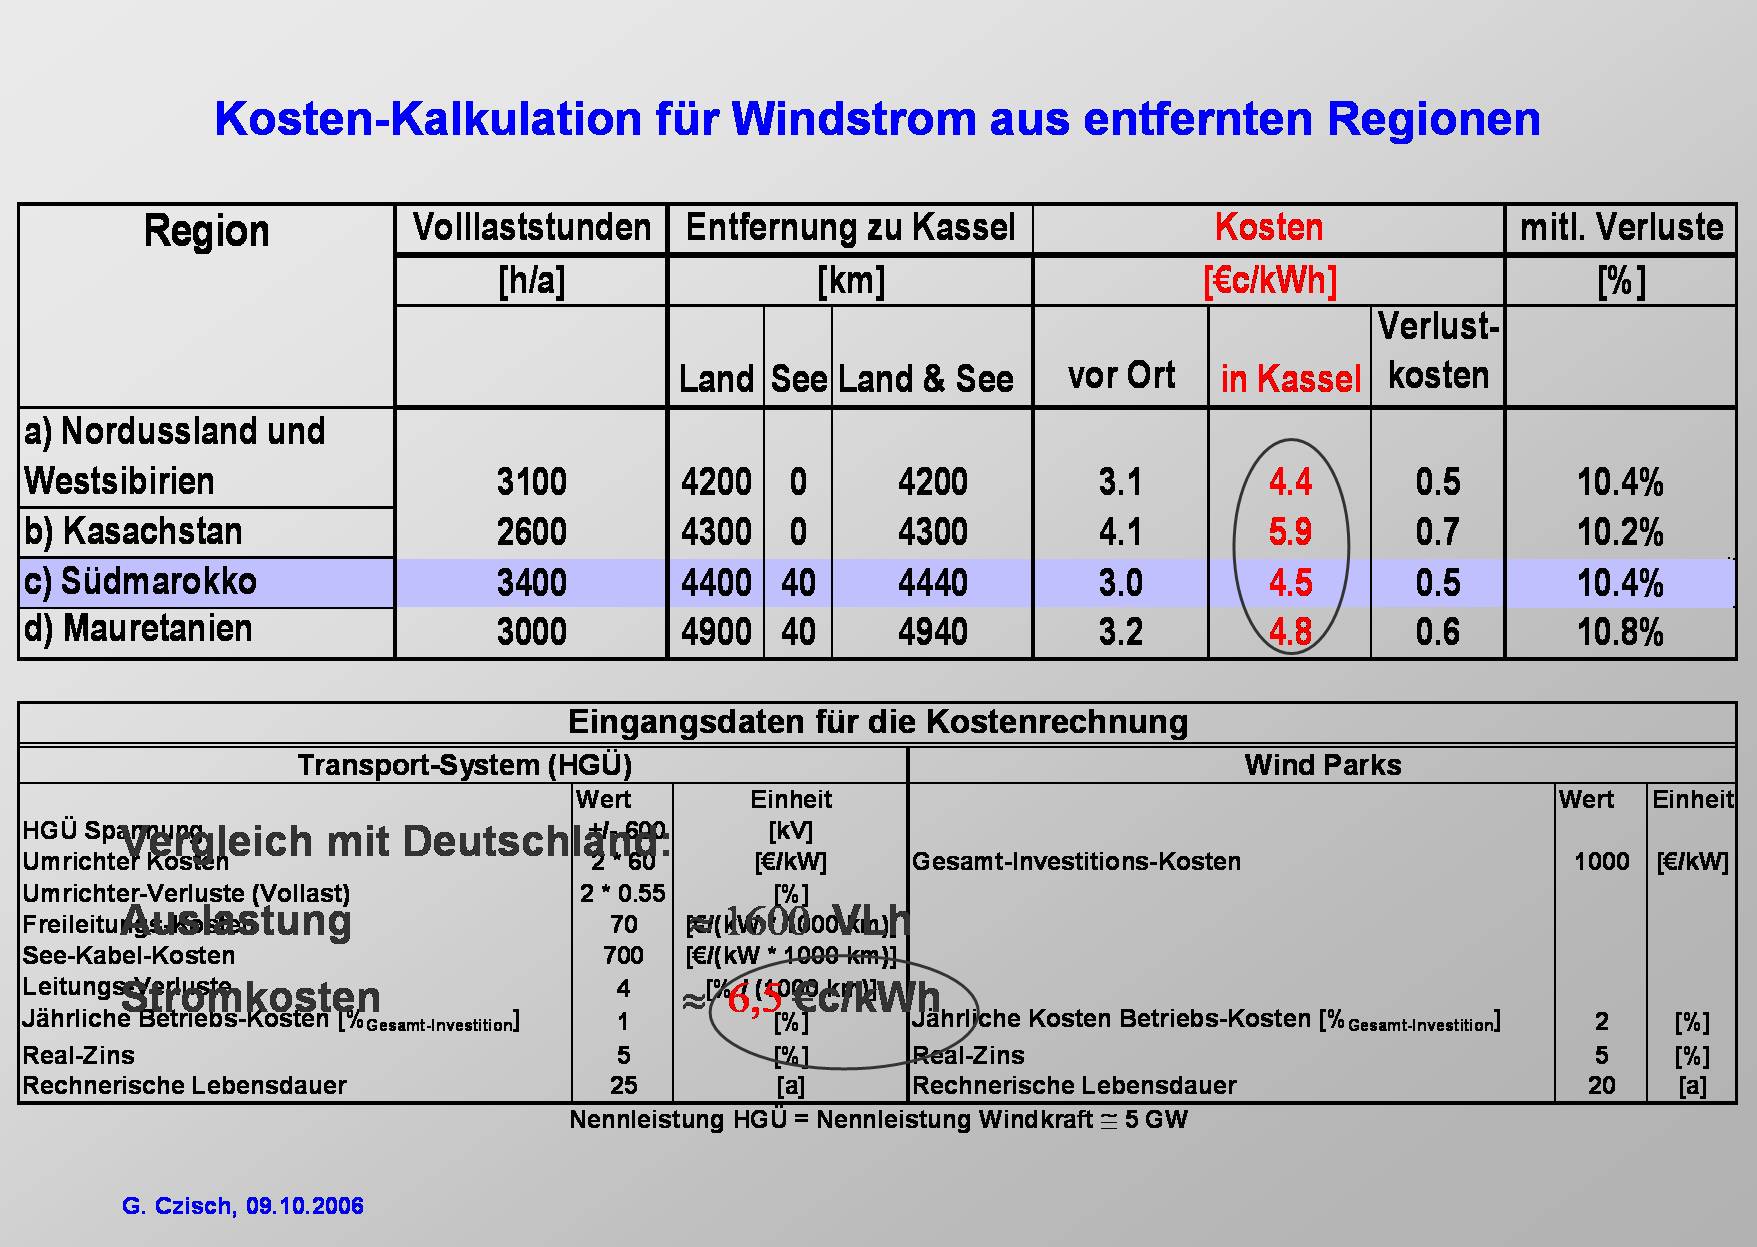
With the underlying economical assumptions based on today's technologies and prices shown in the upper right tables the costs of solar thermal electricity production are calculated for some selected sites. The results are listed in the table at the left side.
Using today's High Voltage DC (HVDC) technology to transport the electricity to Europe (e.g. Kassel GER) the costs of electricity would even for the farest distance mentioned only increase by 30%. The underlying economical assumptions for HVDC technology are shown in the lower right table. The costs of electricity in Kassel do not seem to be very unreasonable. The option to import solar thermal electricity from Northern Africa to Europe becomes even more interesting, if the investment costs for solar fields, the most costly part of SEGS power plants, will reduce. An reduction to roughly 50% of the today's field costs is expected as soon as a capacity of 7 GW of SEGS is erected world-wide. This will reduce the costs of electricity in Kassel to approx. 60% or below 6 €ct/kWh. |
|
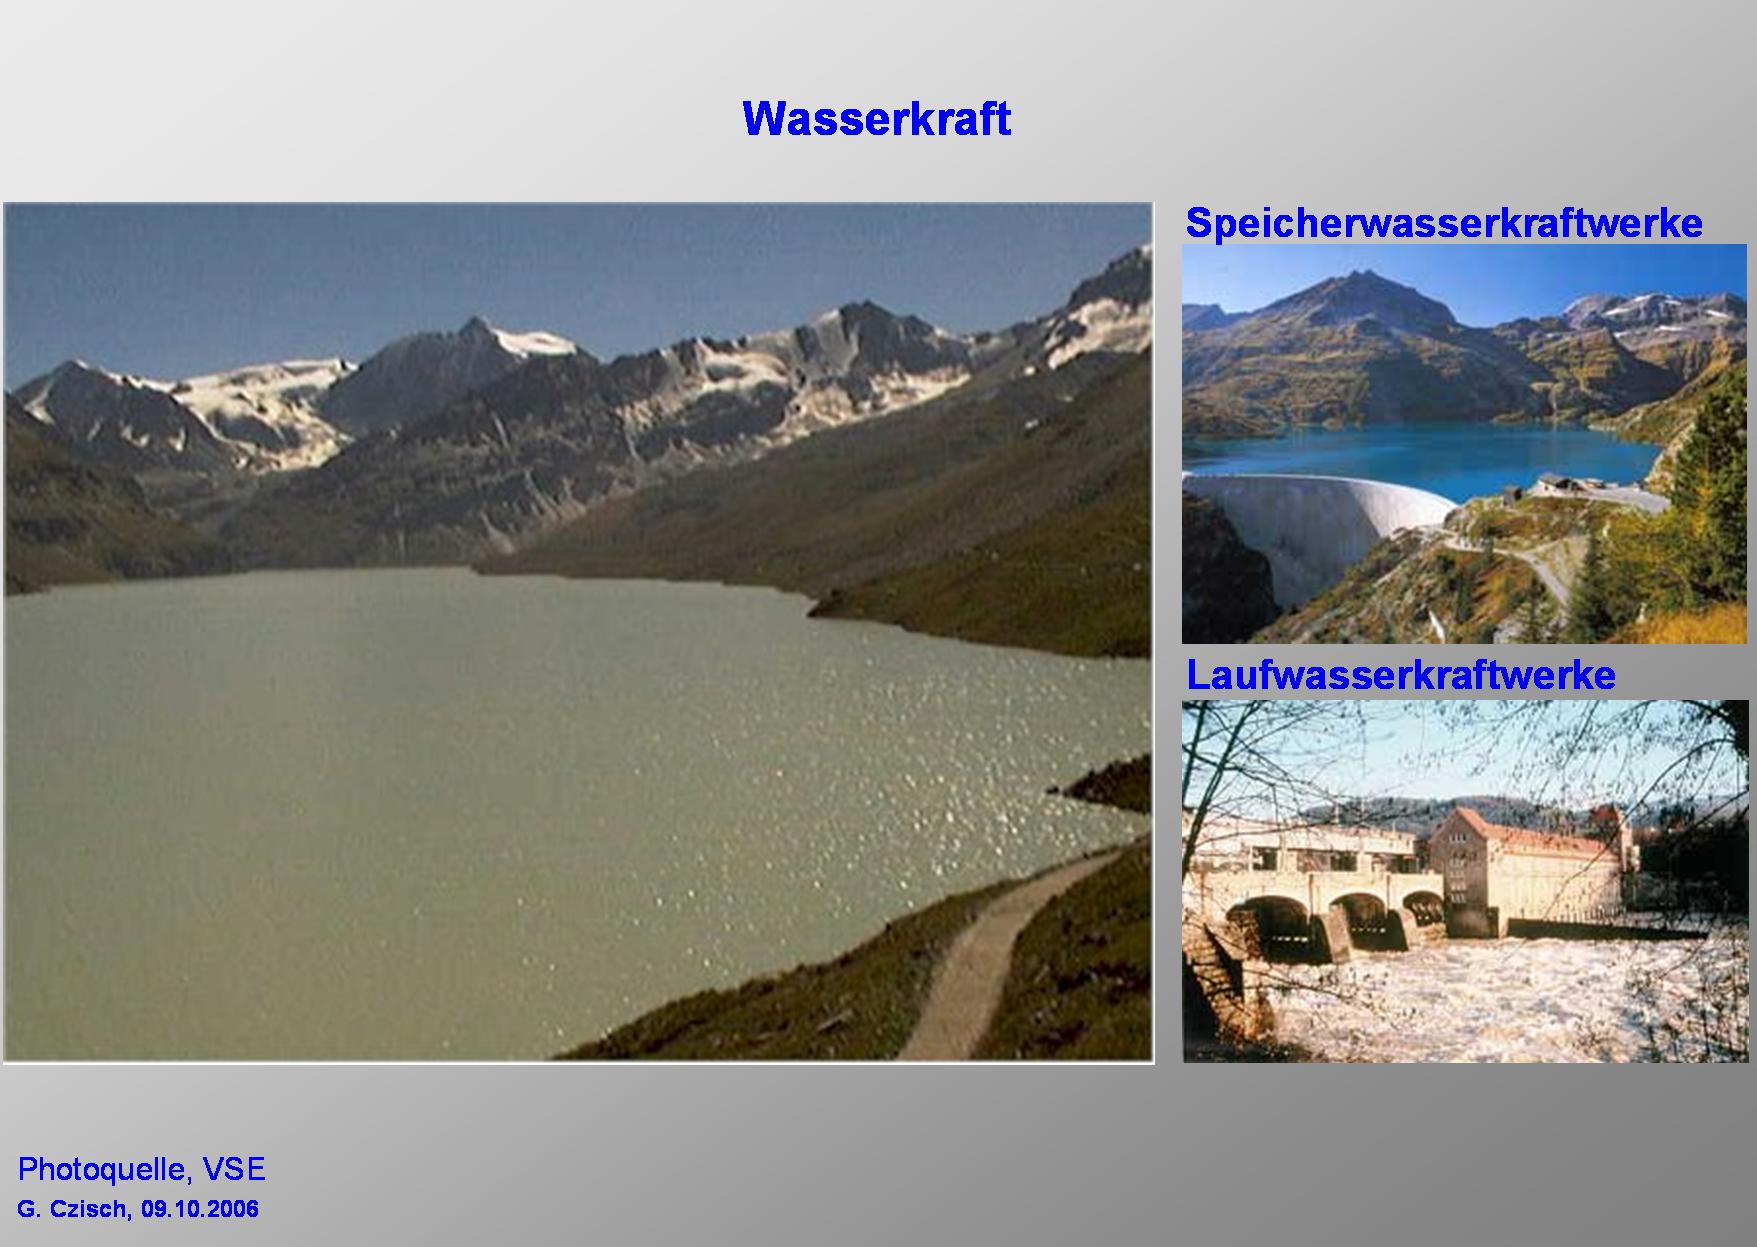
Now we come to hydropower.
Here it is worth to distinguish between two types. The river runoff type uses the water at the time it runs down the river and normally has no or just very little storage capacity. The storage type sometimes can store the water which is running into its reservoir for many months (see following table). So this kind of power plant decouples runoff and electricity production and thus gives the degrees of freedom necessary to be used as back up to balance the variation of other production facilities and of the demand. |
|
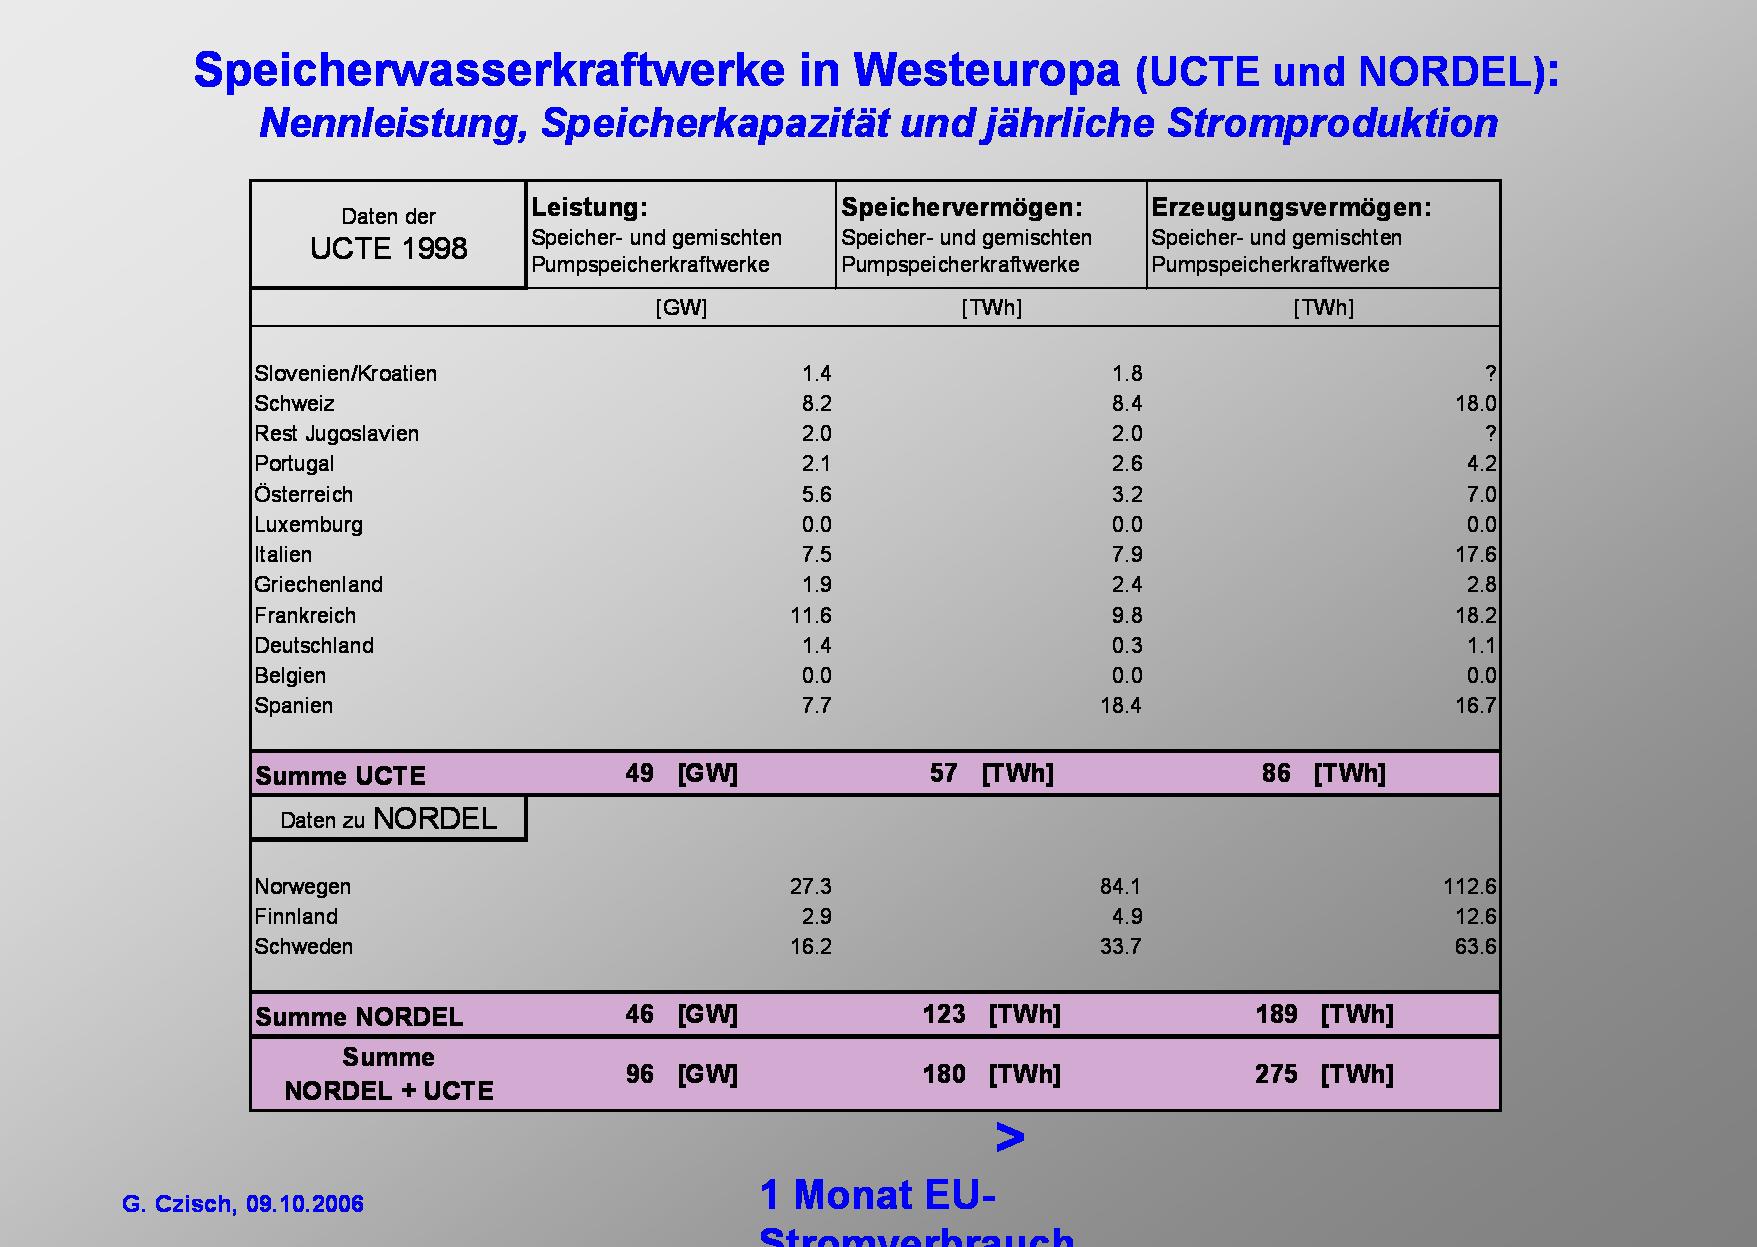
This Table shows the rated power, the storage capacities and the annual energy production of Storage Hydroelectric Power Plants in Western European Countries. The storage capacities are close to 10% of the total electricity production within all the member countries of the EU-15. |

|
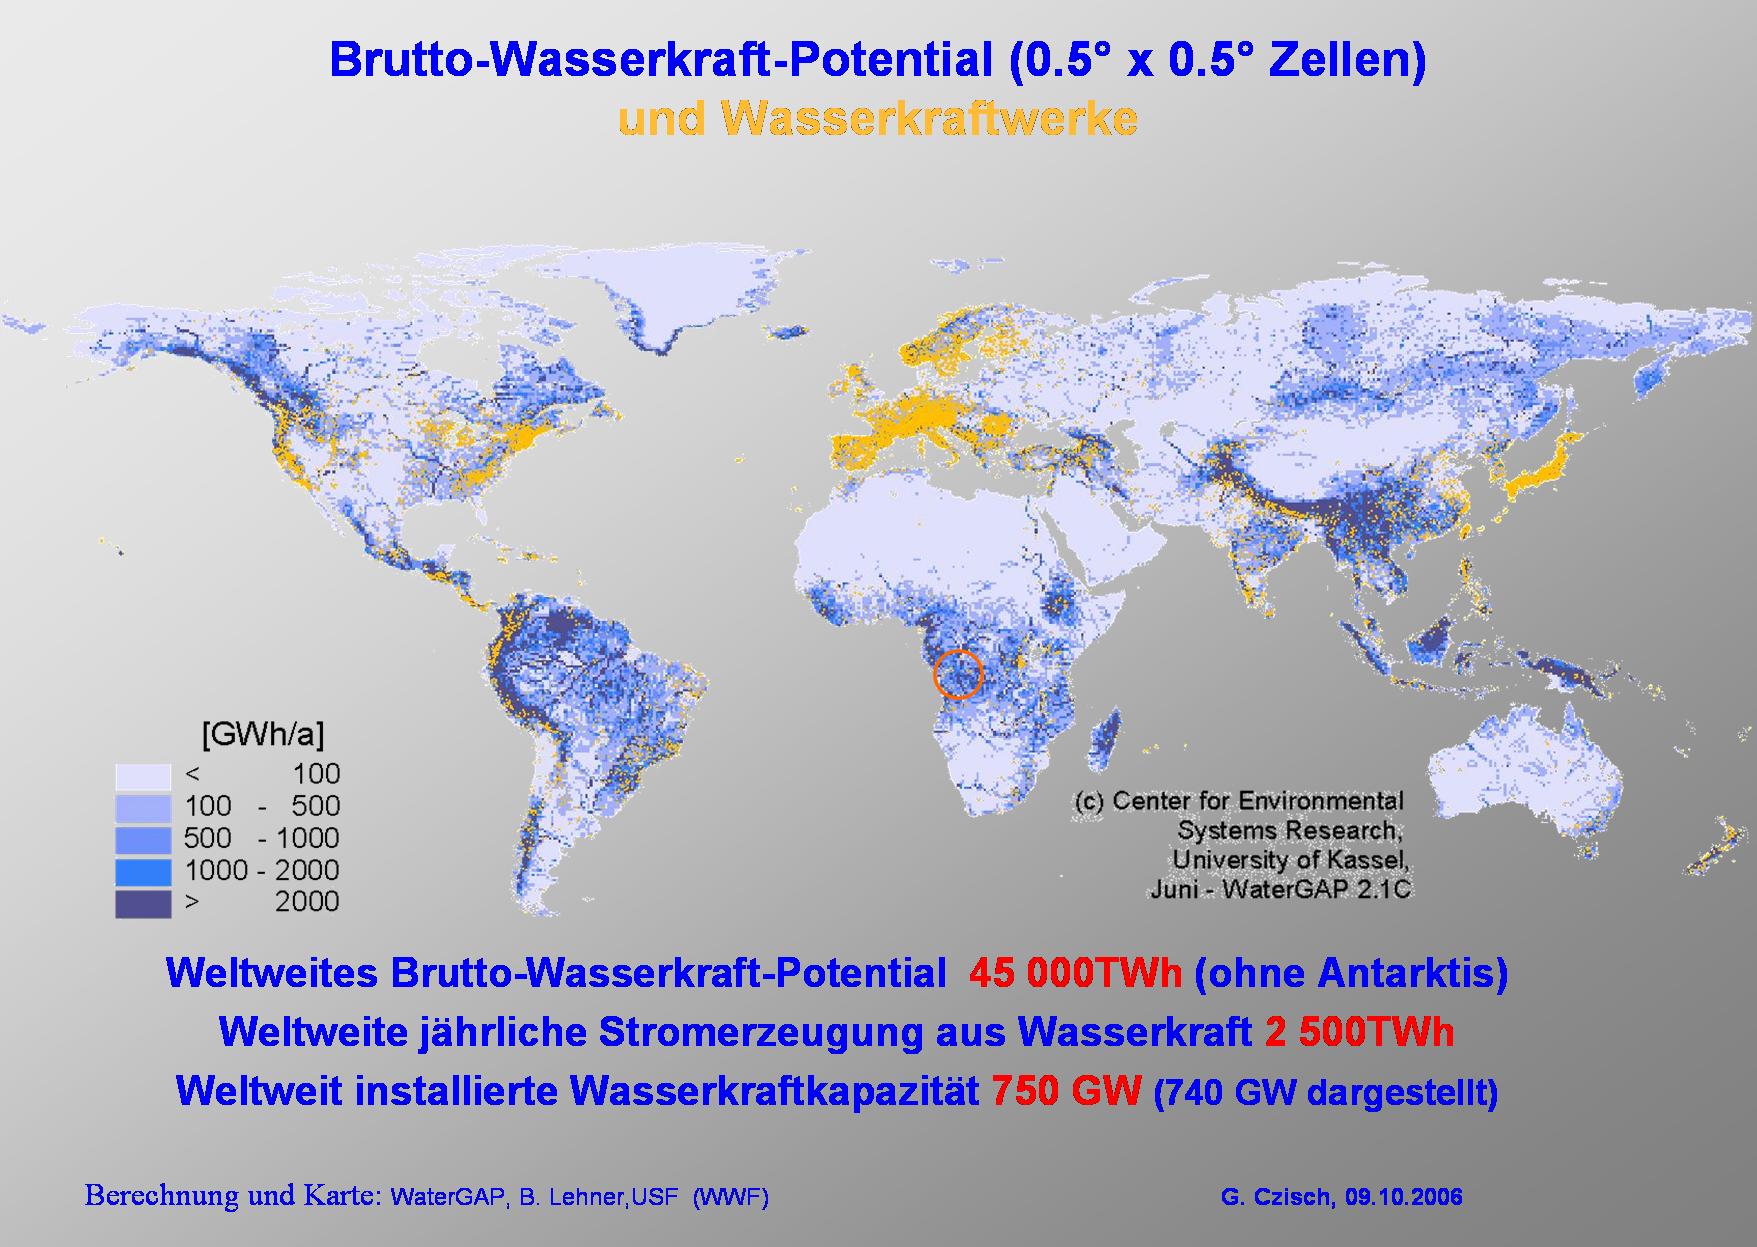
The best hydropower potentials are found in mountainous regions with high annual precipitation. |
|
Especially the industrial countries already use a considerable part of their hydropower potentials.
At Inga at the river Congo there is probably the location where the biggest hydropower plant world wide could be erected. |
|
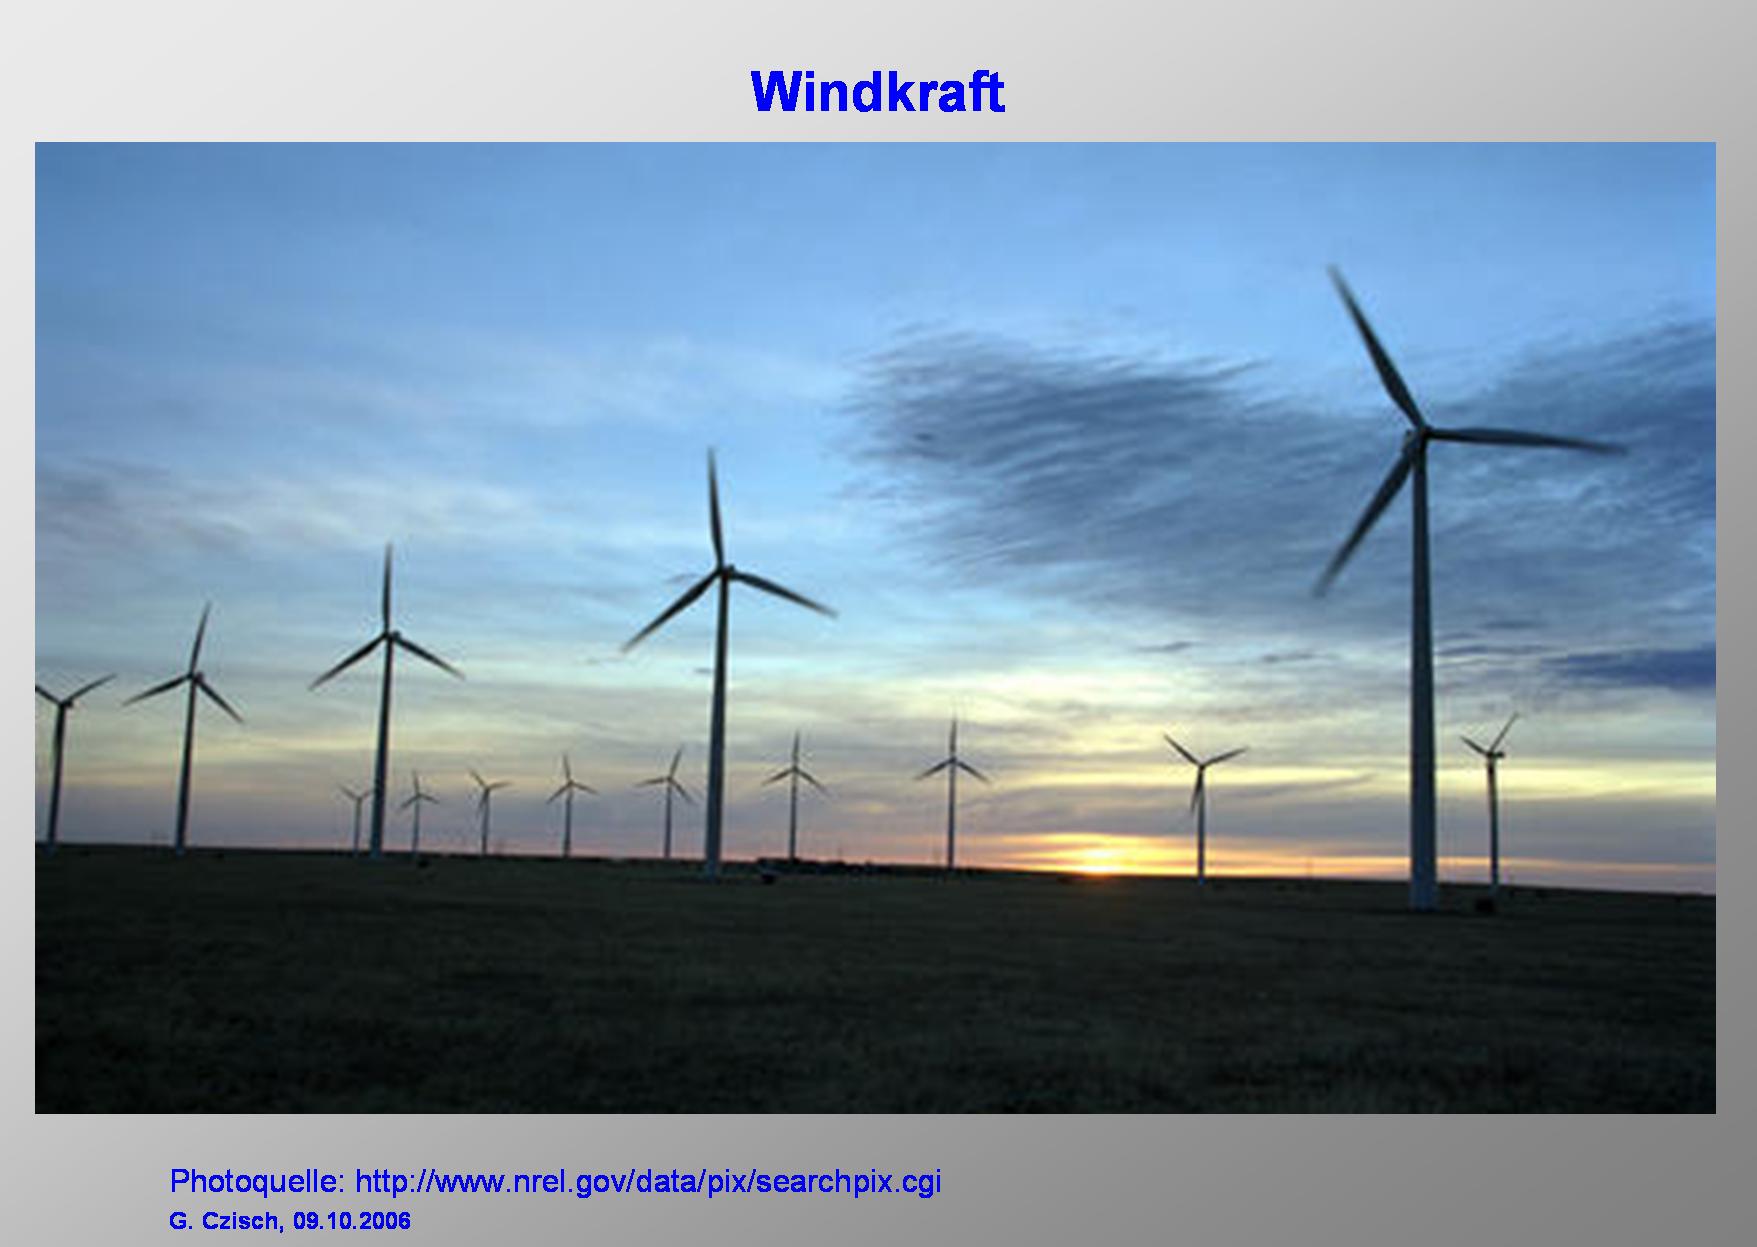
Now we come to wind energy. |
|
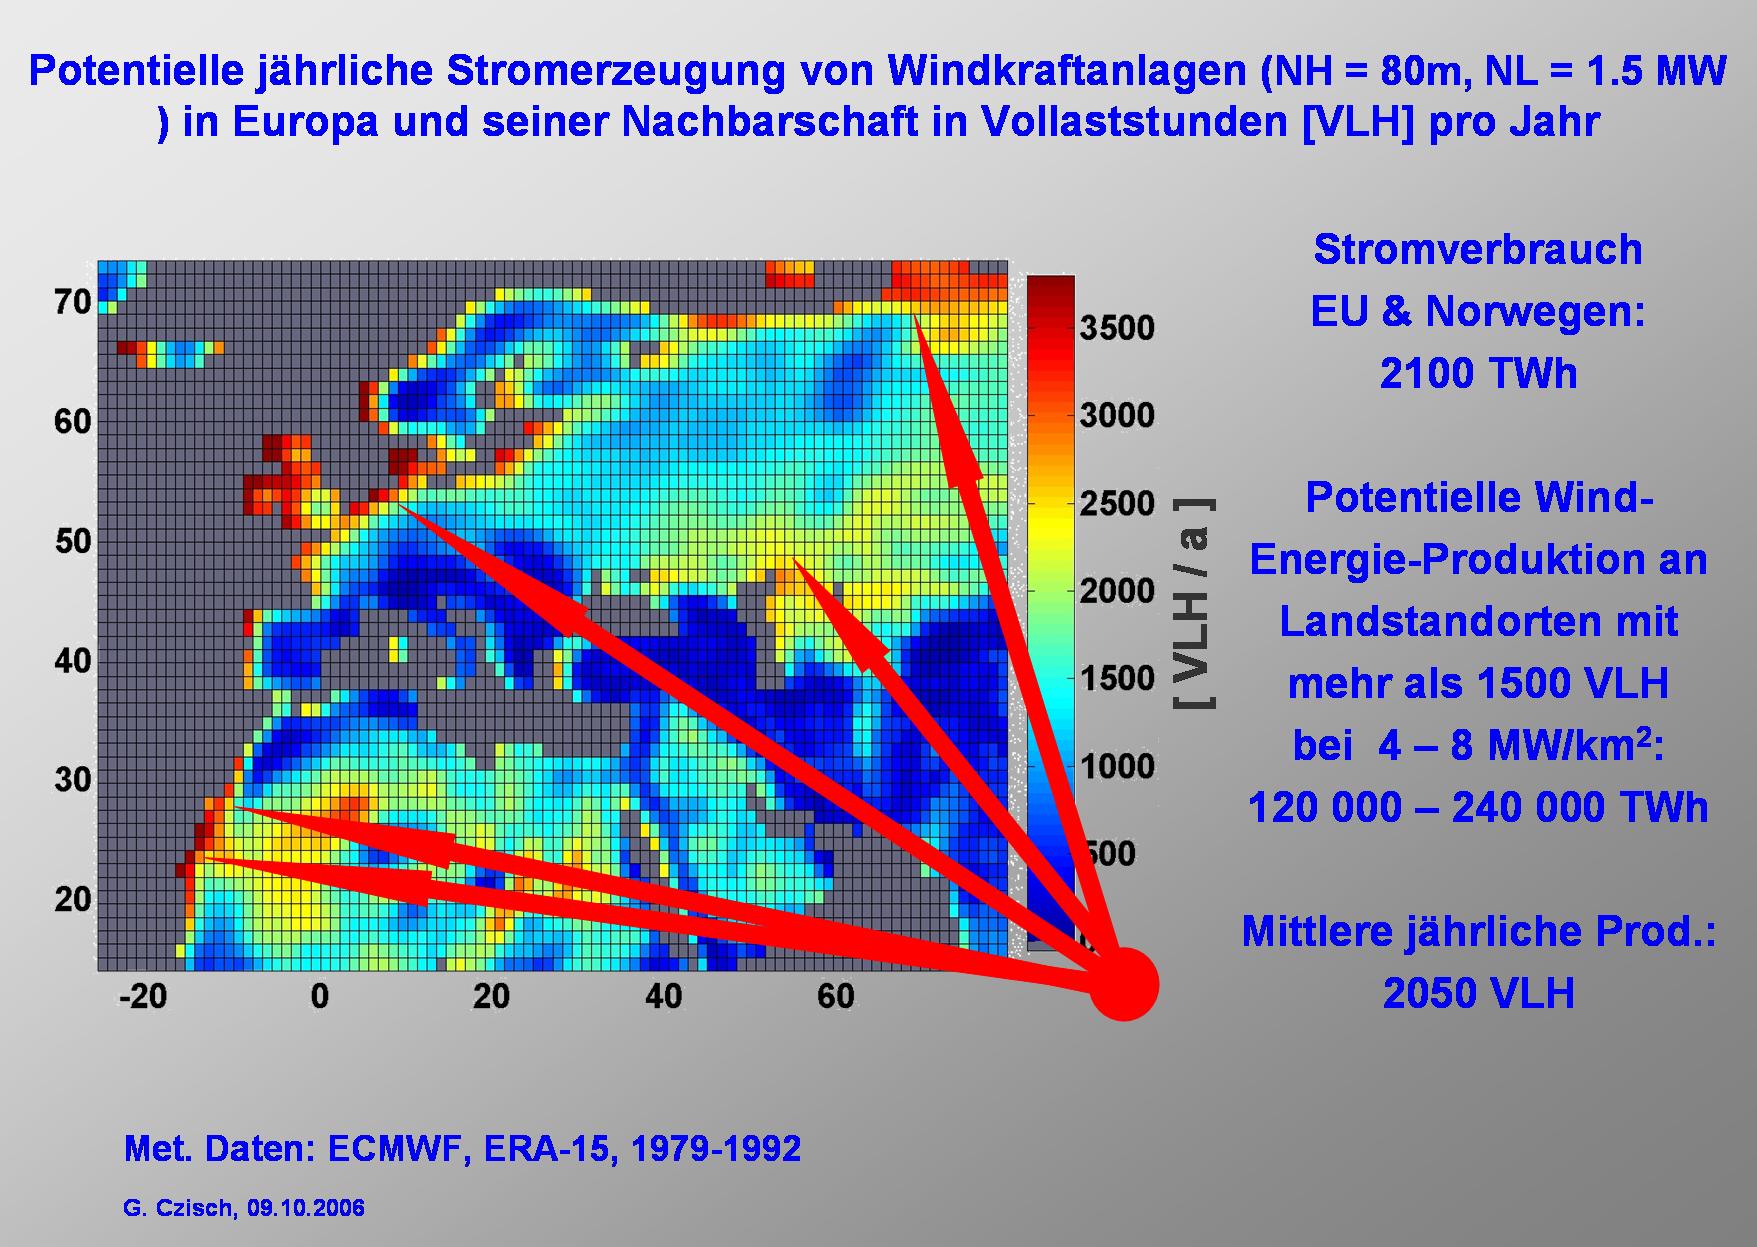
Here you can see the potential production of wind energy calculated from Data of the European Centre for Medium Range Weather Forecast expressed in FLH. Europe itself has good wind conditions. But its use is limited by the high population density. In a belt 4000 to 5000 km away from Kassel which is right in the middle of Germany there are also very good wind conditions and in most of the areas the population density is 2 orders of magnitude smaller than for example in Germany. |
|
The seasonal variation of the potential power production from wind energy shows significant differences in different regions.��On this slide you can see for example the ratio between the average electricity production in July and January.��We see, that Europe is a typical winter wind region with maxima in winter and minima in summer. While for example at the Saharan west coast we find maxima of the production in summer. In some other regions the production in July and January are quite similar. So the idea of selecting the regions in order to get the best match of production and electricity consumption suggests itself. |

|
If we now zoom in and have a view on Europe and its neighbourhood we find the potential production within the shown area only considering Sites with more than 1500 FLH (this is about 40% of the land area shown) is about 100 times higher than the Need of the European Union and Norway or 50 times the electricity consumption of the whole area. (If the best wind sites within the area – according to the ECMWF data used – would be selected till the annual production is equivalent to the annual electricity consumption in the area shown there must be installed wind energy converters (WEC) at roughly 0.4% of the land area shown. About 1% of this area or 0.004% of the total area would then be covered by streets and other infrastructure for the WECs. This is a relatively small fraction it compared e.g. with the area used for different kinds of infrastructure today. In Germany the fraction is about 6% of the total land area which is about 1500 times as much.)
It is possible to be quite selective and choose only the better regions. As an example I selected the following.
To use these potentials we have to have high transport capacities. |

|
Now we look closer to the five selected regions.
Comparing the monthly mean wind power of the selected European regions and the Demand of the EU & Norway one can see that the fluctuations of the production varies much more than the demand. Europe is a typical winter wind region with maxima in winter and minima in the summer month. |
|
Also the monthly means in Southern Morocco vary much more than the demand, but it is a passat wind region with summer maxima. |
|
It is obvious that the use of simultaneous production in different regions can much better fit the demand.
This shows the black line which represents a combination of of the five selected regions. But not only the long term behaviour changes with the size and selection of the catchment area. Now let us consider we produce the equivalent of the demand from wind Energy. For the demand EU & Norway we need to install 660 GW to within all regions. |
|
Following this simple example I would like to illustrate the influence of a combined production of electricity at the selected 5 regions shown before.
The duration curve of the hourly electricity consumption depicted in the slide represents a total rated power of 465 GW and a demand of 1940 TWh. The maximum power demand is 295 GW, the minimum about 140 GW. |
|
Now we ask the question: What happens if we produce as much electricity from wind energy as the annual consumption.
The duration curve of the difference between wind power production and demand is shown in the green line. The maximum power surplus and lack are each roughly 200 GW. The lack of energy amounts to 14% of the demand. |

|
In Europe hydro power storage systems exist with relatively high rated power and storage capacities.��The annual production of the storage hydropower within our supply area is 15% of its demand. So it is slightly higher than the lack of energy from the considered wind power production and so more than enough to compensate the lack of energy.� |
|
|
|
|
|
|
|
|
|
|

|
|
|
|
|
|

|
|
|
|
|
|
|
|
|
|

|
|
|
|

|