
Lecture Magdeburg 2001 - Slide 43: Unterschied zwischen den Versionen
Aus Transnational-Renewables
(Die Seite wurde neu angelegt: „{{Slide|VM2001_slide|en|43}}“) |
|||
| Zeile 1: | Zeile 1: | ||
{{Slide|VM2001_slide|en|43}} | {{Slide|VM2001_slide|en|43}} | ||
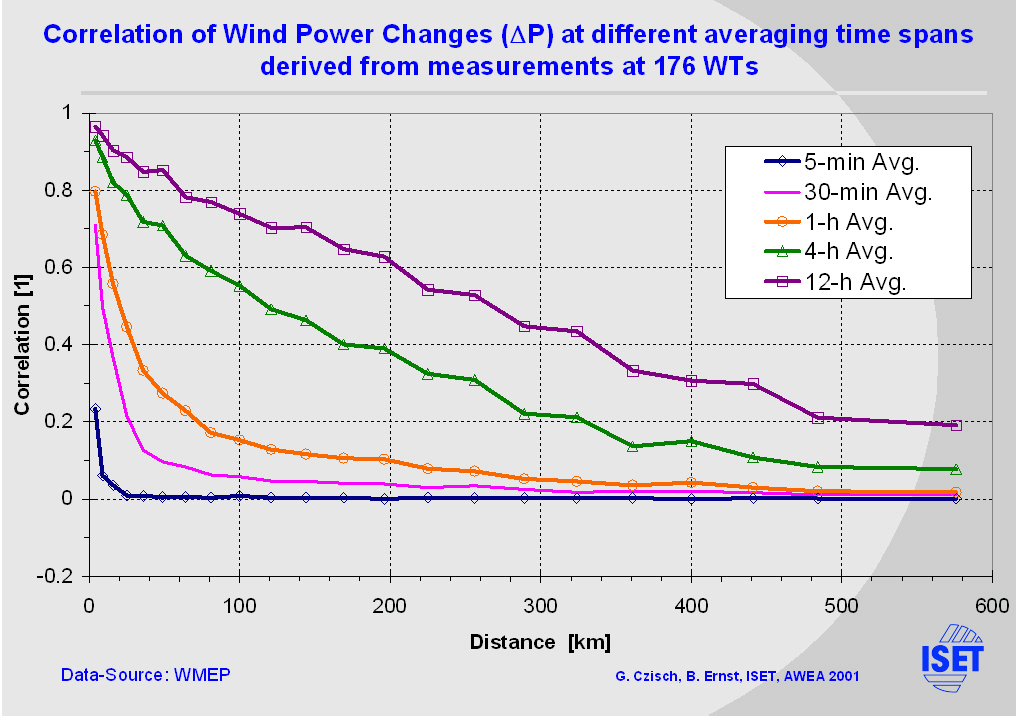
| + | This graph shows the correlation of the change of wind power printed versus the distance between the wind turbines. This is given for different averaging times. | ||
| + | |||
| + | For example the 5 minute correlation falls to almost zero after a distance as short as 20 km. While the 12 hour values reach a correlation coefficient of 0.2 at a distance of 500 km. | ||
Aktuelle Version vom 3. Oktober 2010, 12:14 Uhr
| Lecture Magdeburg [2001,en], Vortrag Lübeck [2006,de], Lecture Barcelona [2008,en], Vortrag EWEA 2000 [2000,en] |
| Vorstellung regenerativer Energien: Biomasse, Windenergie, Fallwindkraftwerke, Geothermie, Wasserkraft, Solarenergie |
|
Overview
|

|
This graph shows the correlation of the change of wind power printed versus the distance between the wind turbines. This is given for different averaging times.
For example the 5 minute correlation falls to almost zero after a distance as short as 20 km. While the 12 hour values reach a correlation coefficient of 0.2 at a distance of 500 km.