
Lecture EWEA 2000 - Overview
Aus Transnational-Renewables
| Lecture Magdeburg [2001,en], Vortrag Lübeck [2006,de], Lecture Barcelona [2008,en], Vortrag EWEA 2000 [2000,en] |
| Vorstellung regenerativer Energien: Biomasse, Windenergie, Fallwindkraftwerke, Geothermie, Wasserkraft, Solarenergie |
Slides of my speech @ Wind Power for the 21 Century
- held on 25. september 2000 in Kassel
|
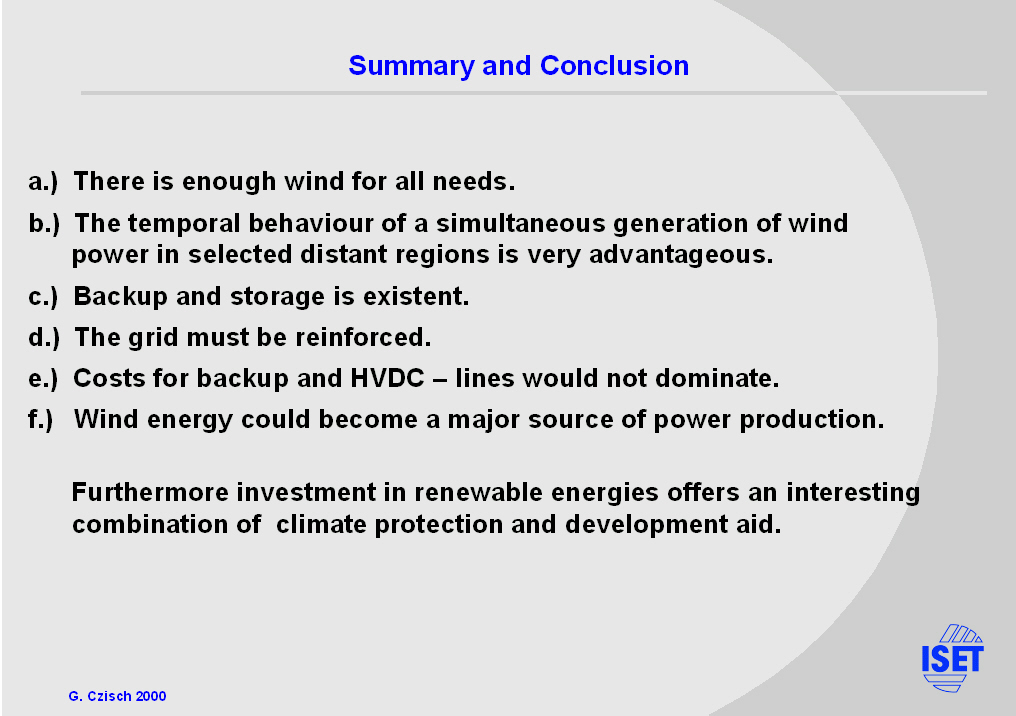
In my speech I would like to compare Intra and Extraeuropean options for an energy supply with wind power. I will give a short inside in the wind energy potentials and point out the change of the temporal behaviour if different catchment areas are used. Thereby we strive the topics of backup and storage needs and the subject of grid capacities. After this I consider wind energy as major source of power production. And last but not least I am going to reflect about a possible combination of climate protection and development aid. |
|
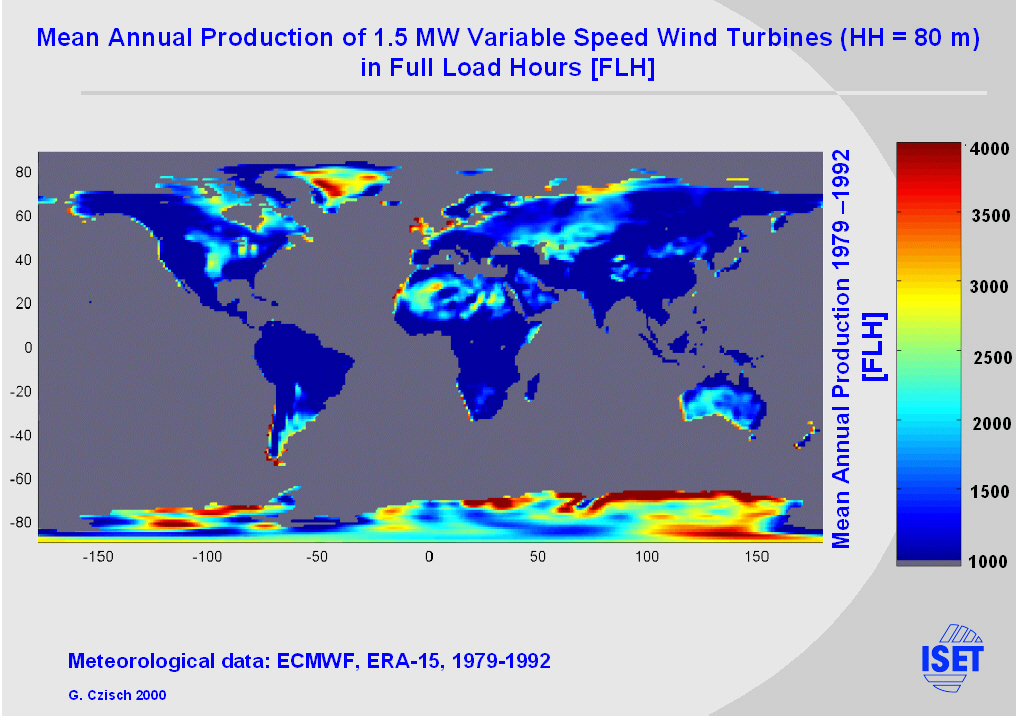
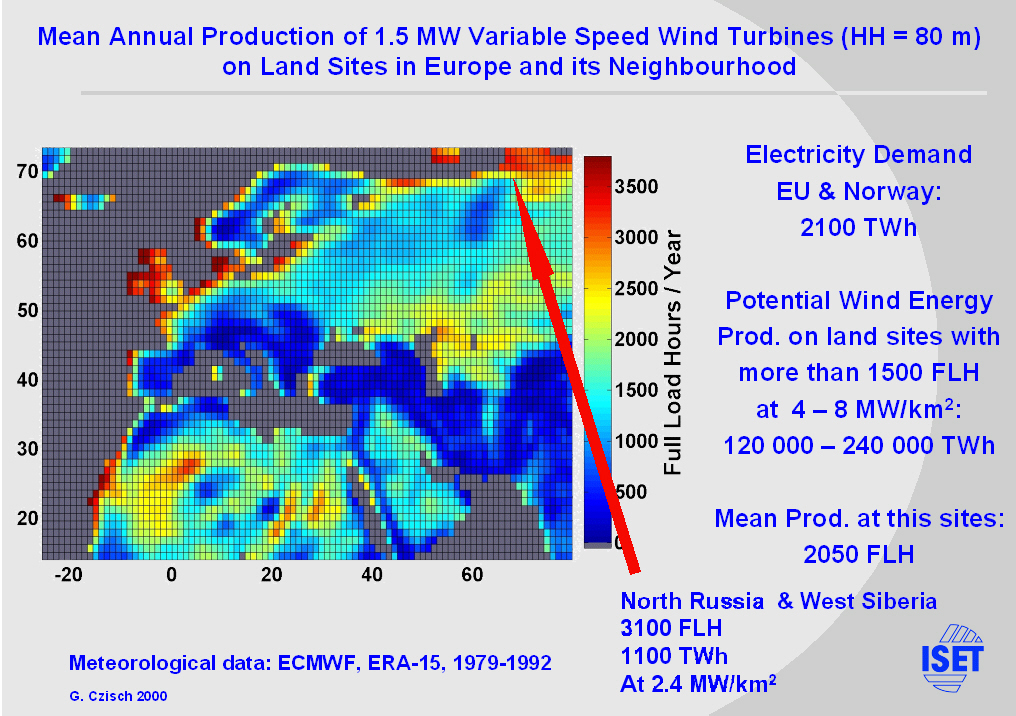
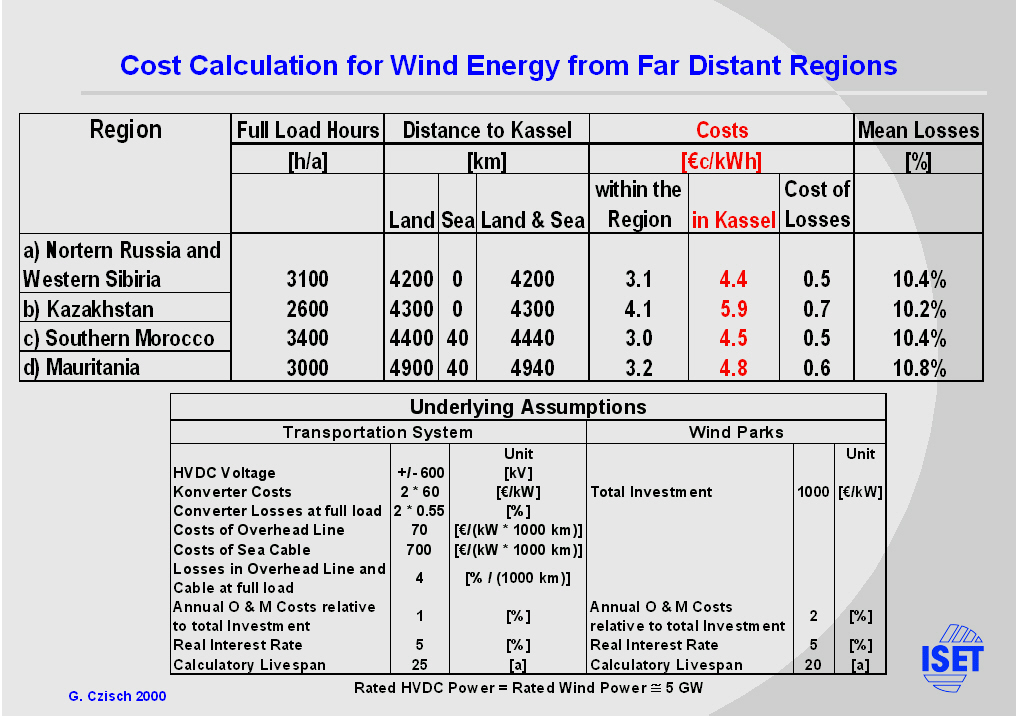
Here you can see the potential production of wind energy calculated from data of the European Centre for Medium Range Weather Forecast expressed in FLH. Europe itself has good wind conditions. But its use is limited by the high population density. In a belt 4000 to 5000 km away from Kassel there are also very good wind conditions and in most of the areas the population density is 2 orders of magnitude smaller than for example in Germany. |
|
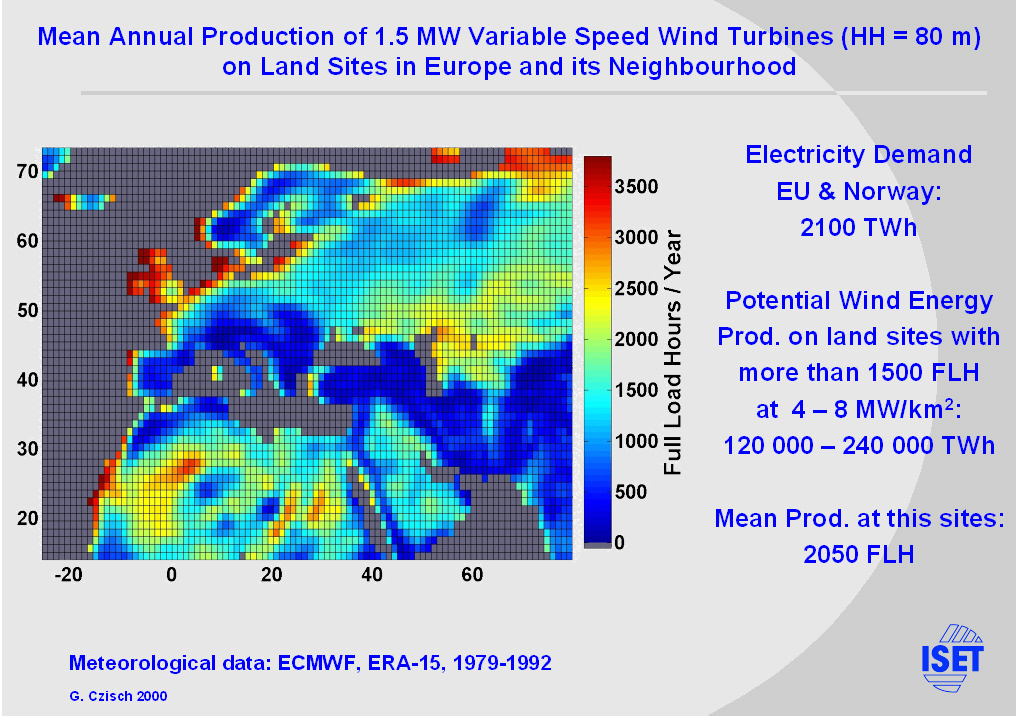
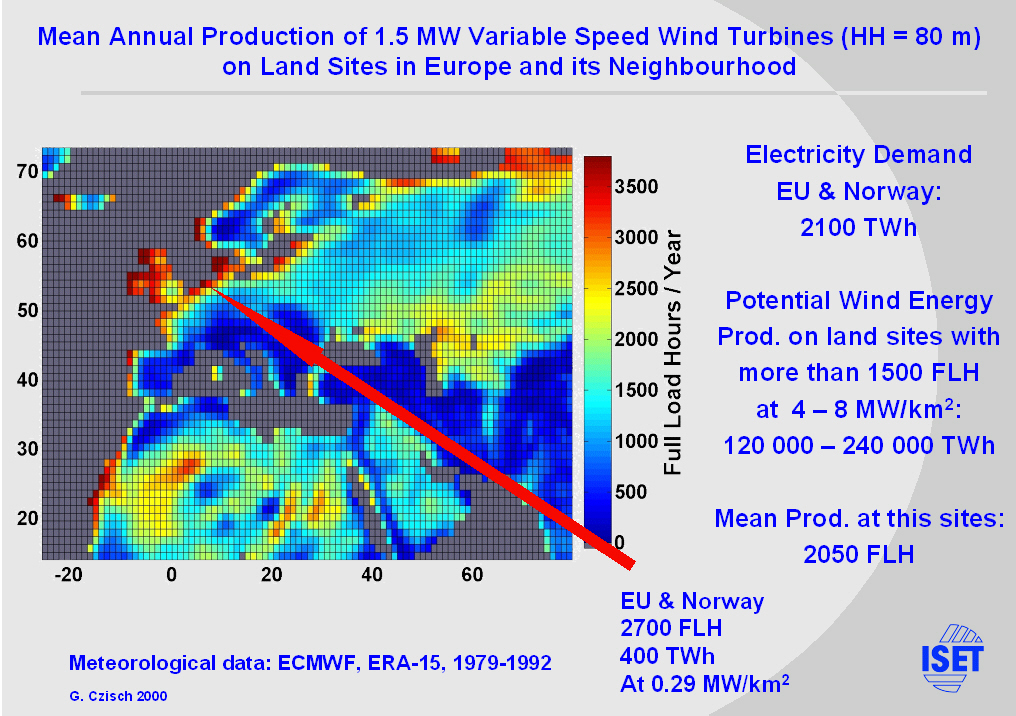
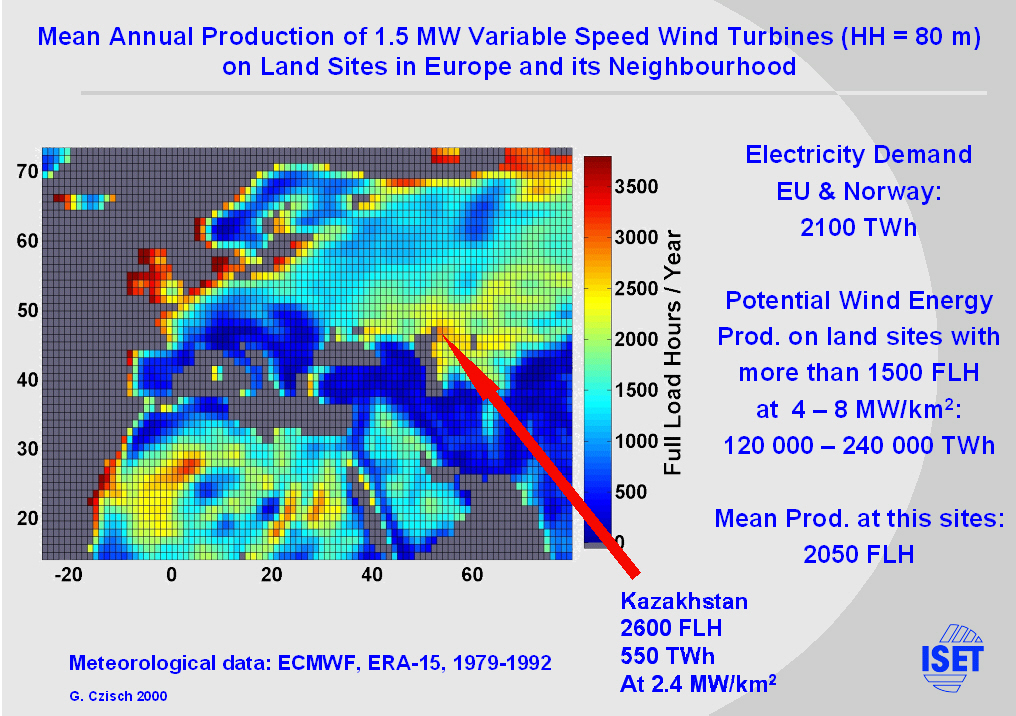
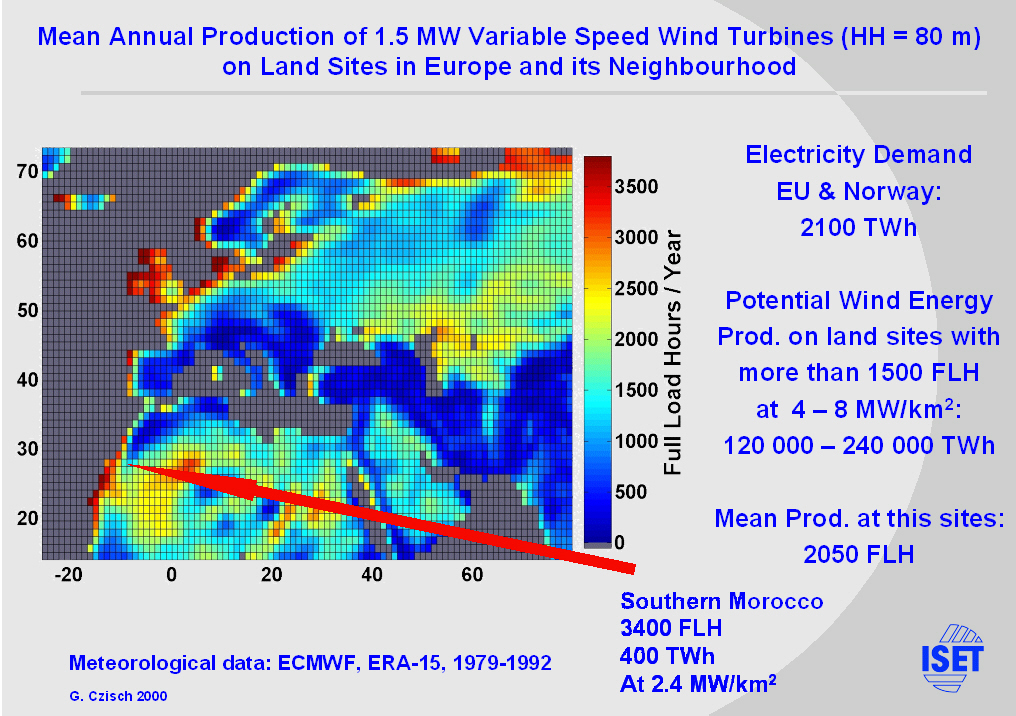
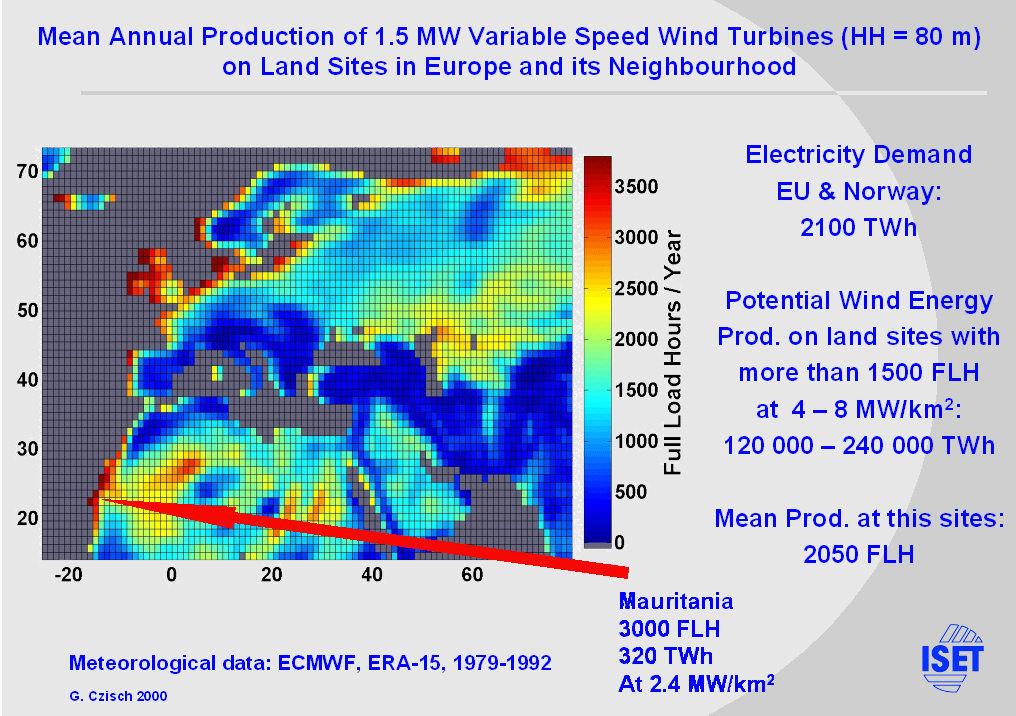
If we now zoom in and have a view on Europe and its neighbourhood we find that the potential production within the shown area only considering Sites with more than 1500 FLH is about 100 times higher than the Need of the European Union and Norway. So it is possible to be quite selective and choose only the better regions. As an example I selected the following. |
|
1.) Good wind sites within EU & Norway. (With restrictions due to the high population density.) |
|
2.) The Jamal Region with northern Russia. (The calculated production quite good compares with independent calculations of Risø et al. see REFERENCES[4]. |
|
3.) Parts of Kazakhstan. (Single measurements see REFERENCES [5] in the text version} confirm these expectations. Another study arrives at significantly higher velocities, from which 4000 FLH at selected sites can be derived see REFERENCES[3]. |
|
4.) Southern Morocco (The calculated production is rather conservative. Due to measurements in this region significantly higher production up to 5000 FLH is expected.) |
|
5.) Mauritania also has good wind conditions.
To use these potentials we have to have high transport capacities. |
|
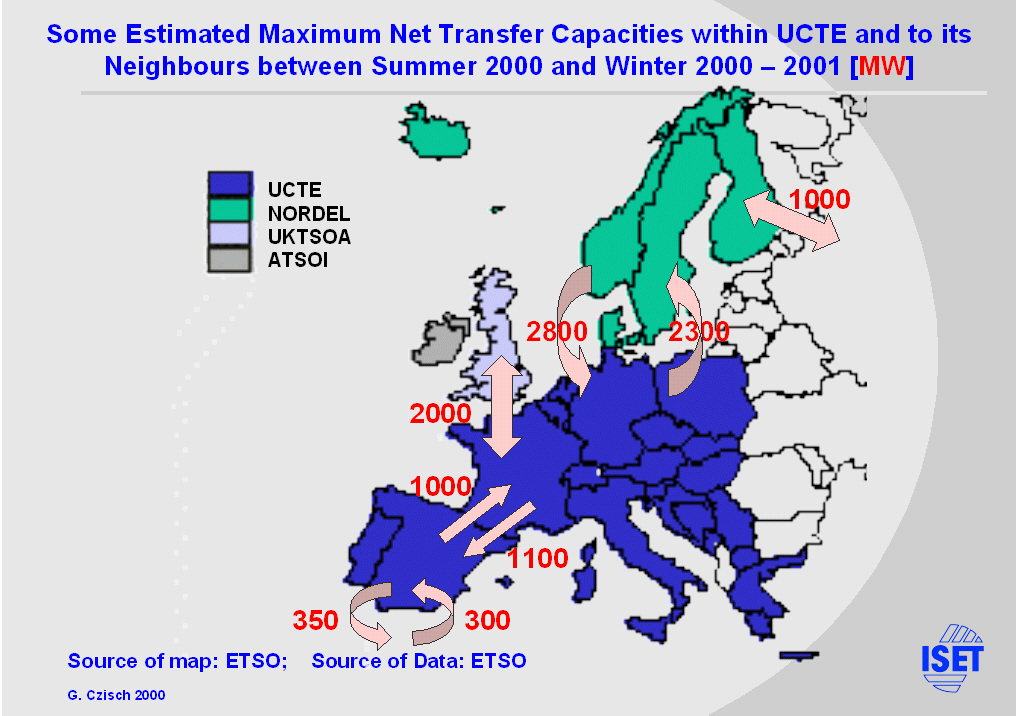
The European electricity network within and especially between the countries is too weak for very high wind power penetration. This is also true for the connection to Africa.
For example the Net Transfer Capacities from Morocco to Spain with its 350 MW and the 1100 MW from Spain to France would not allow high power transfer. |
|
Economically the option of wind power import is interesting even if new transport capacity is included.
But not only the low population density and the low costs of imported wind power are notable. The temporal behaviour of the power production changes with the size of the catchment area. |
|
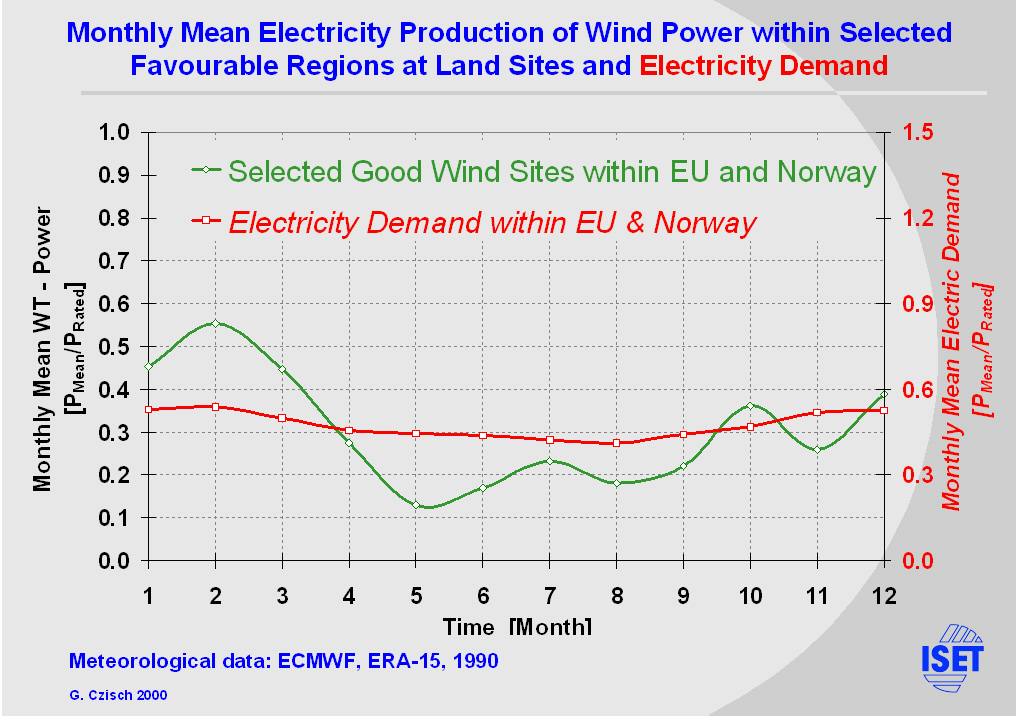
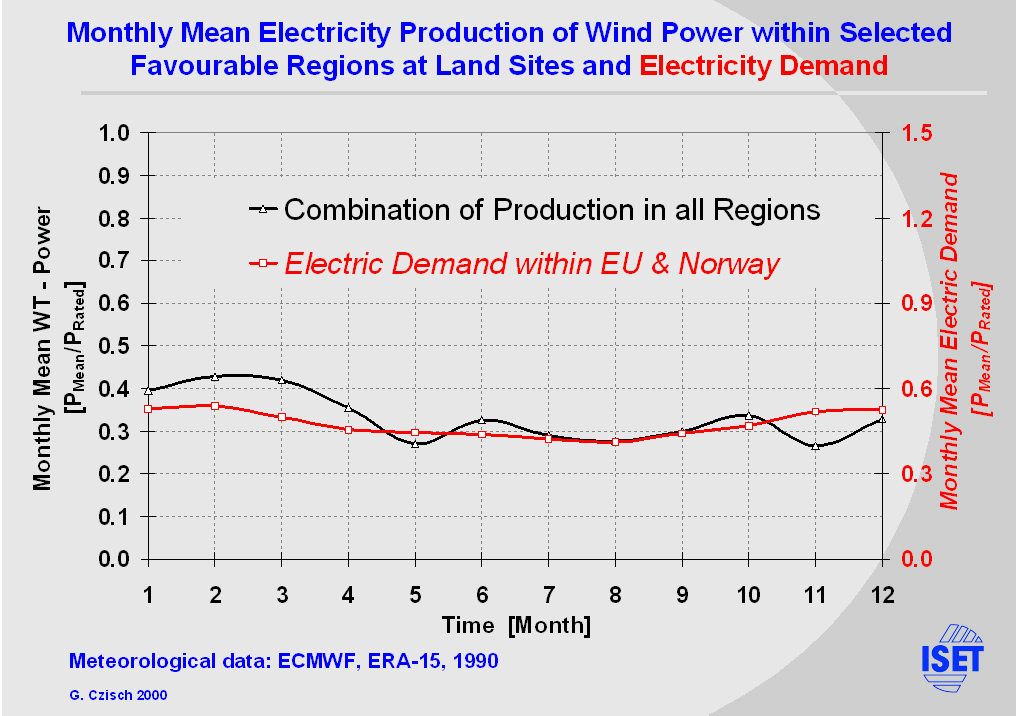
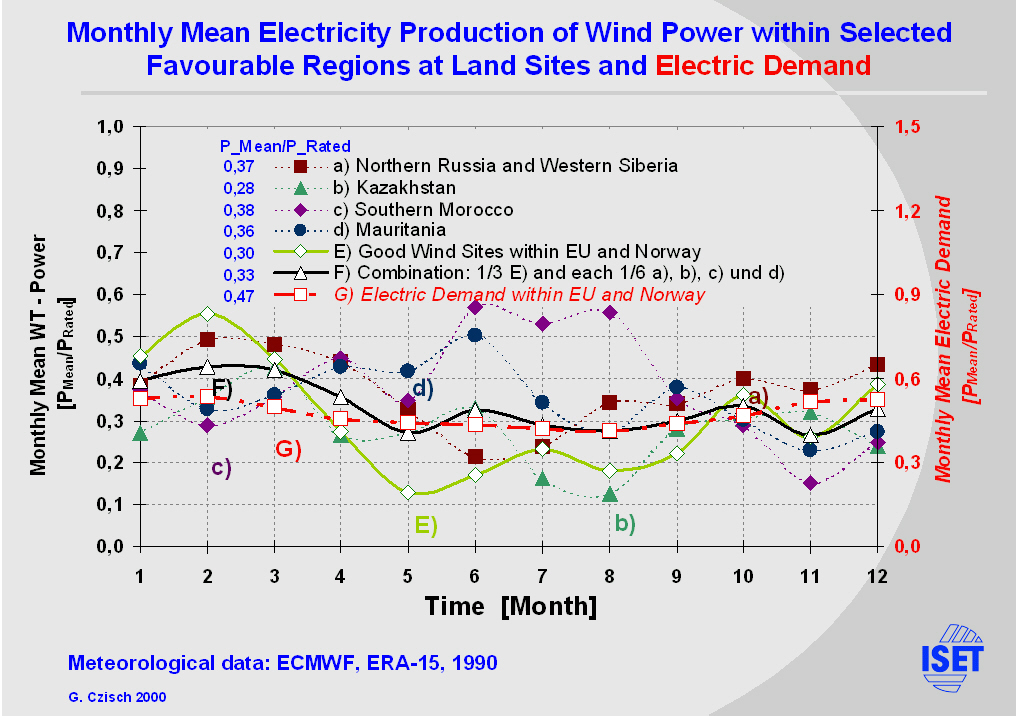
Comparing the monthly mean wind power of the selected European regions and the Demand of the EU & Norway one can see that the fluctuations of the production varies much more than the demand. Europe is a typical winter wind region with maxima in winter and minima in the summer months. |
|
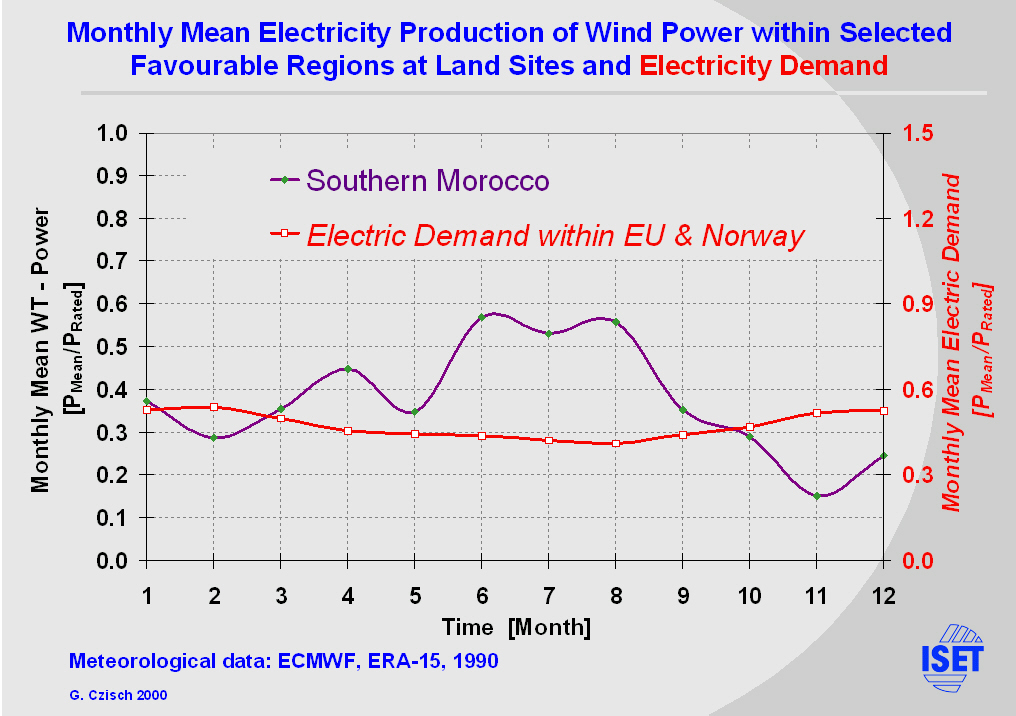
Also the monthly means in Southern Morocco vary much more than the demand, but it is a passat wind (tradewind) region with summer maxima. |
|
It is obvious that the use of simultaneous production in different regions can much better fit the demand. This shows the black line which represents a combination of the five selected regions.
But not only the long term behaviour changes with the size and selection of the catchment area. (see the production of all regions engaged) |
|
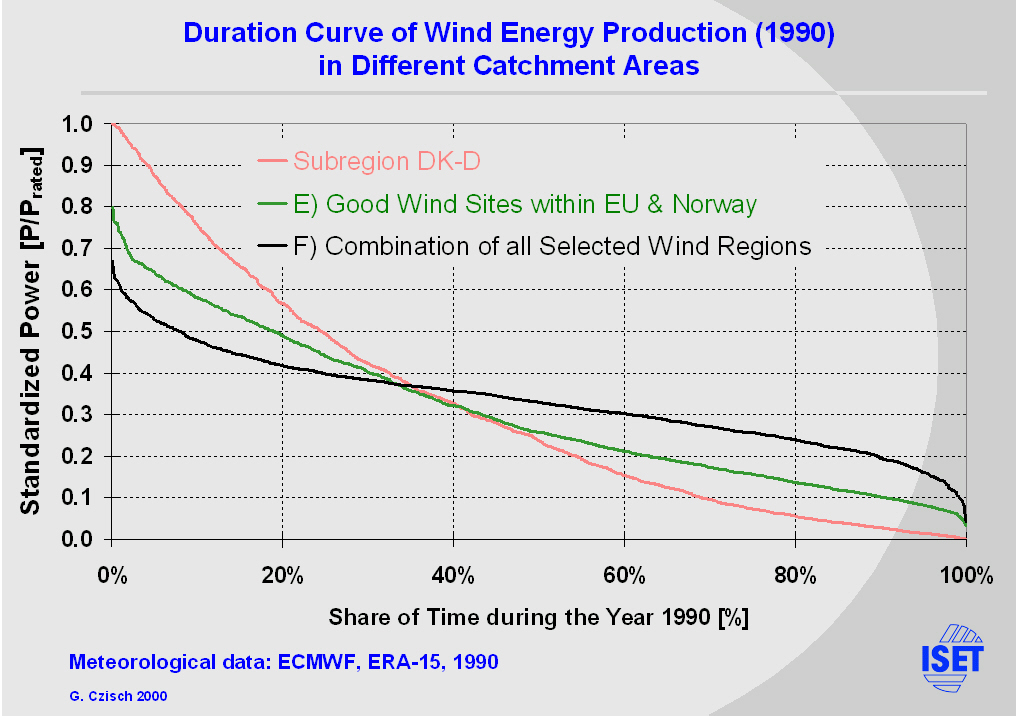
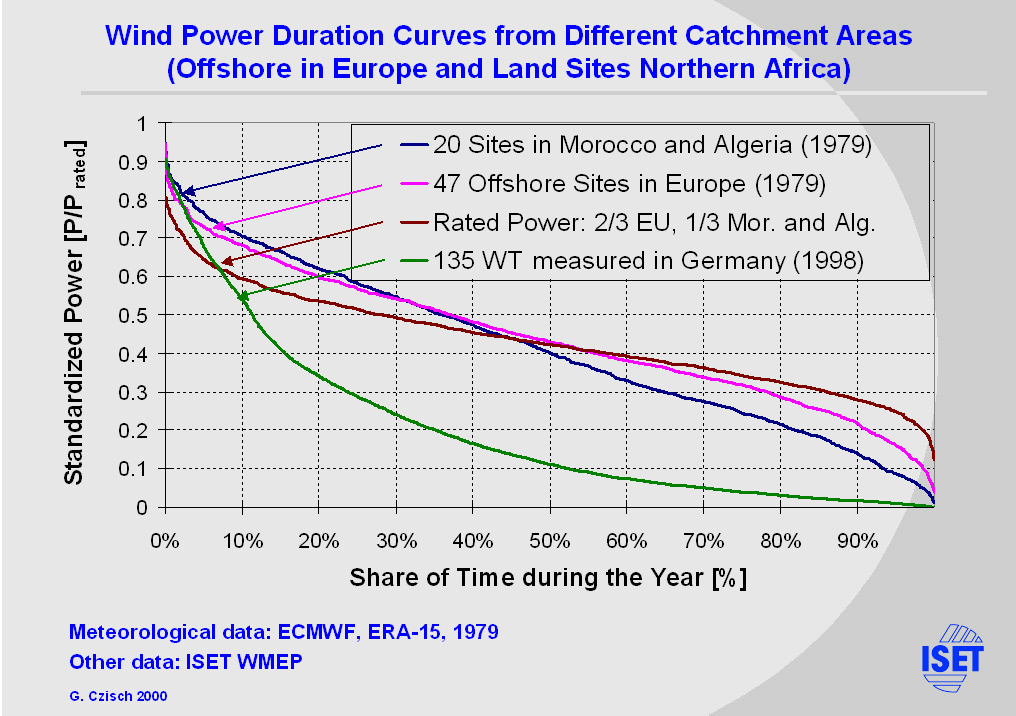
Comparing the duration curves of wind power production at different catchment areas we see that the maxima decline with the size.
|
|
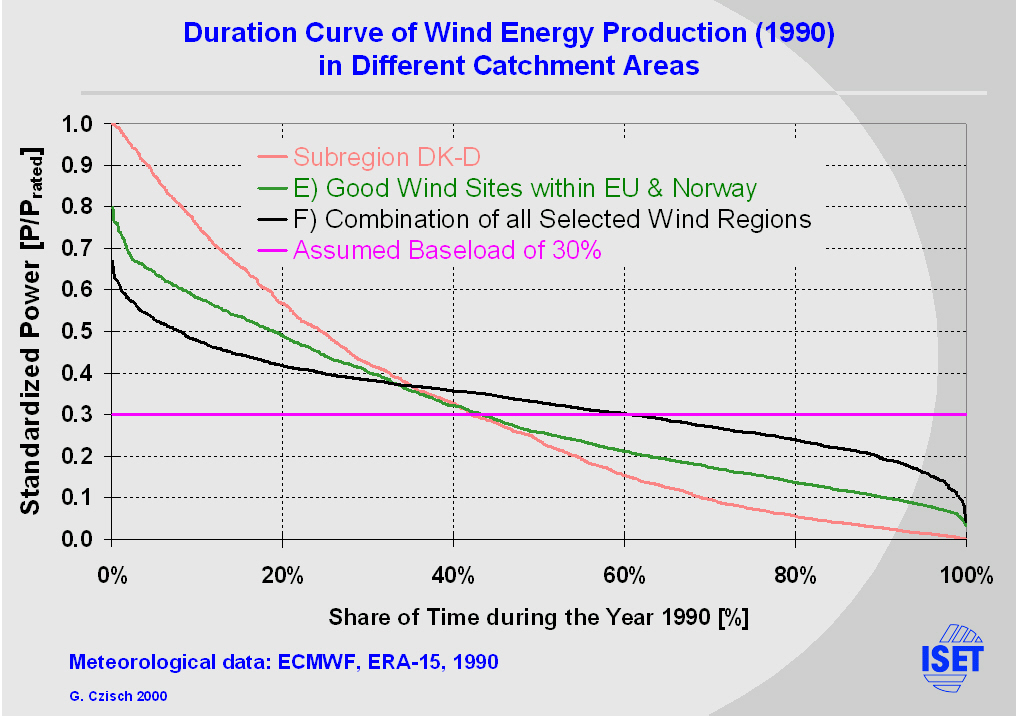
Let us assume we want to produce a base load of 30%.
Now we have some Excess and some lack of power. |
|
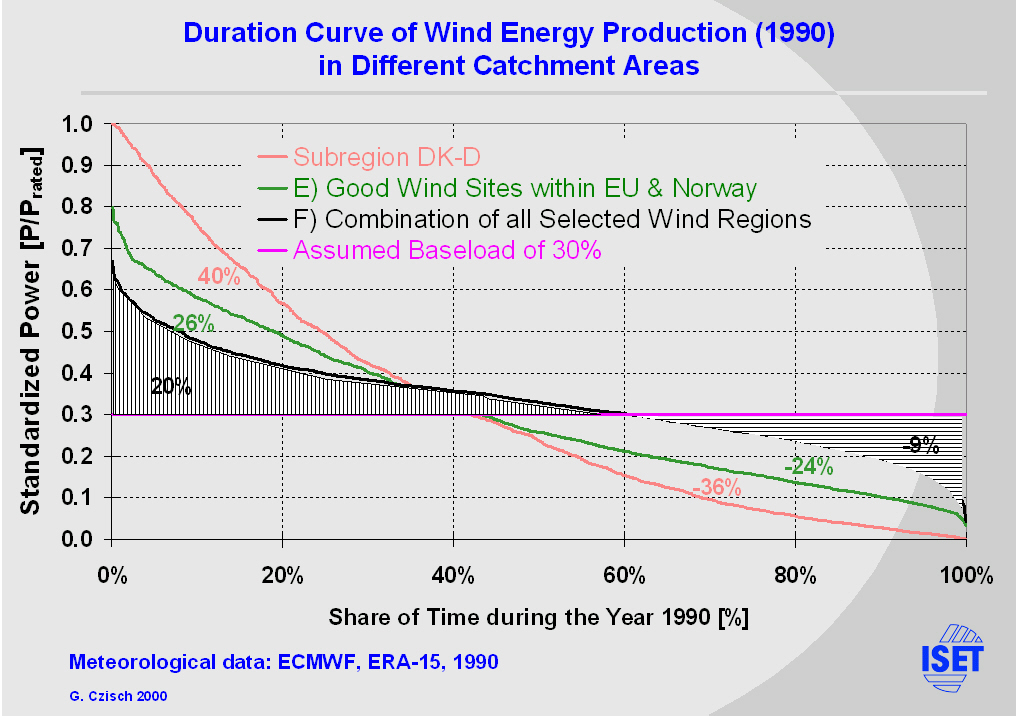
For example the smallest region would produce 40% of the base load in excess but on the other hand there were 36% missing.
At the simultaneous use this lack declines to only 9%. |

|
So we would need this 9% as backup energy and a rated backup power of 26% of the wind turbine capacity. This could be produced from gas turbines, costing roughly 250 €/kW.
The investment in the backup system is about 7% of the investment in the wind turbines. This means that costs for the backup system would not at all be a dominant factor of the system‘s economy. |
|
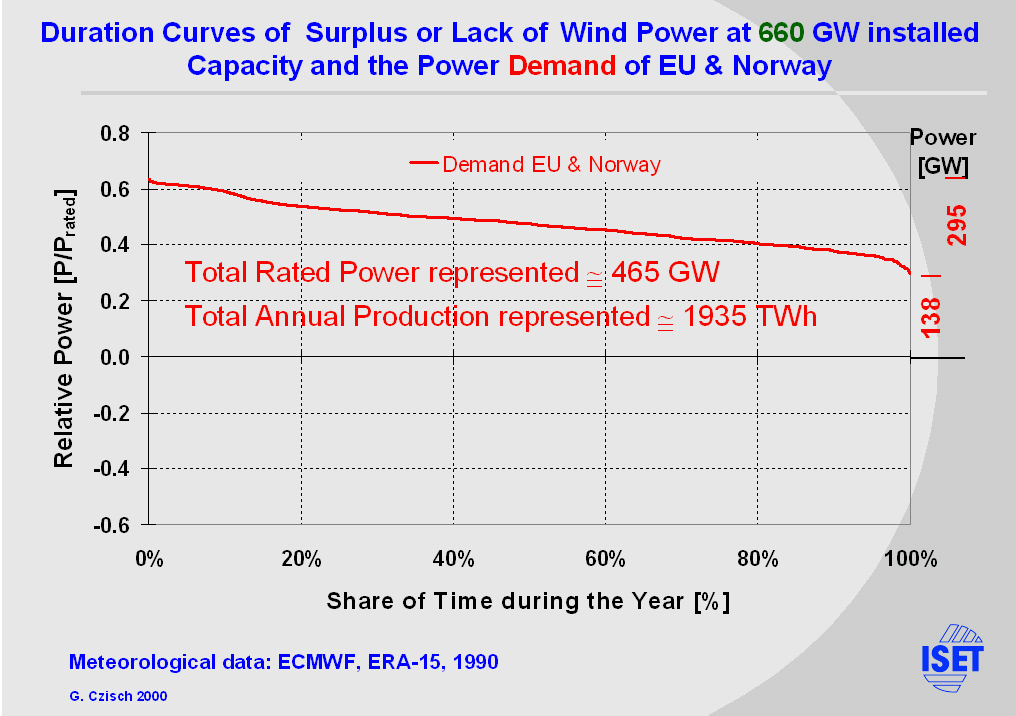
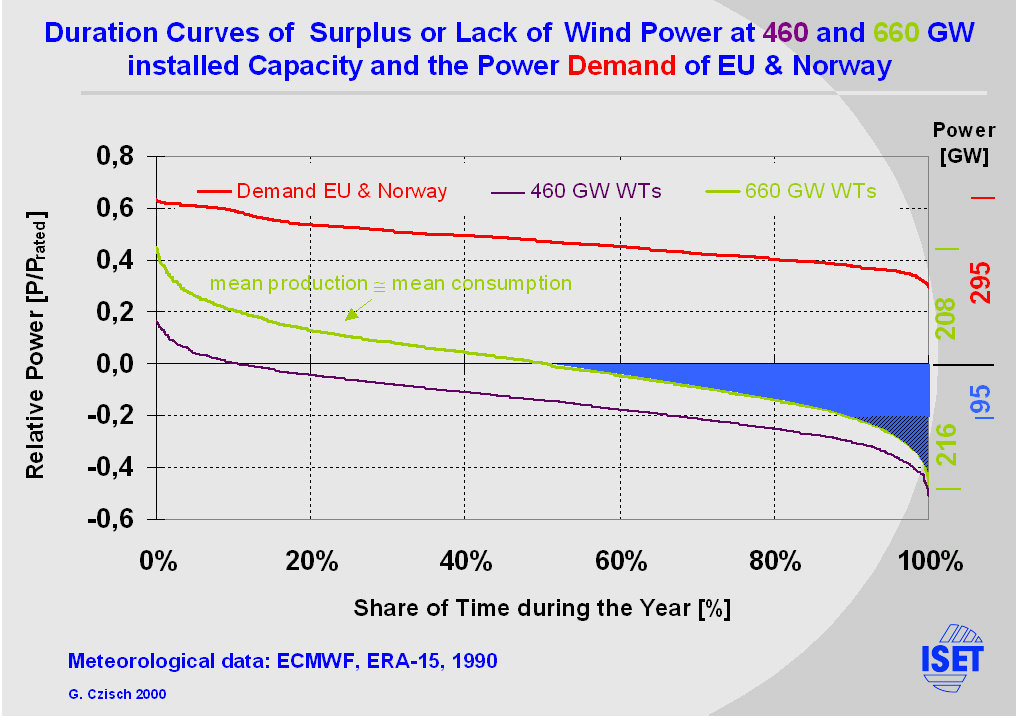
Now let us consider we produce the equivalent of the demand from wind energy.
For the demand in EU & Norway we need to install 660 GW within all regions. First there is the duration curve of the demand printed on the slide. It represents a total rated power of 465 GW and a demand of 1940 TWh. The maximum power demand is 295 GW the minimum about 140 GW. |

|
The difference between wind power production and demand is shown in the green line. The maximum power surplus and lack are each roughly 200 GW. The lack of energy amounts to 14% of the demand. |

|
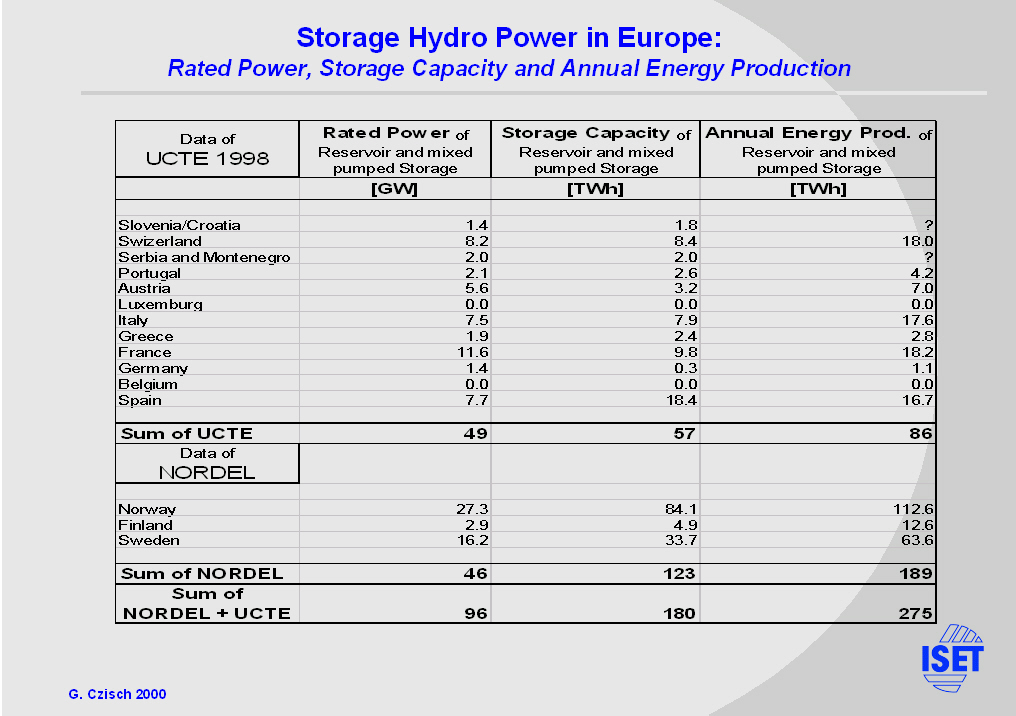
In Europe there exist storage systems with relatively high rated power and storage capacities.
The annual production of the storage hydropower within our supply area is 15% of it‘s demand (see Table:Storage Hydro Power UCTE & NORDEL). So it is slightly higher than the lack of energy from the considered wind power production and so more than enough to compensate the lack of energy. |

|
But the 96 GW rated power of the storage hydropower plants is too small to compensate the lack of power. The difference is still 120 GW.
There are many possibilities to get the necessary backup power. One was to enlarge the rated power at the reservoirs as it sometimes is done to provide peak load capacity. An other way is to use thermal units which also could be fired by Biomass. |
|
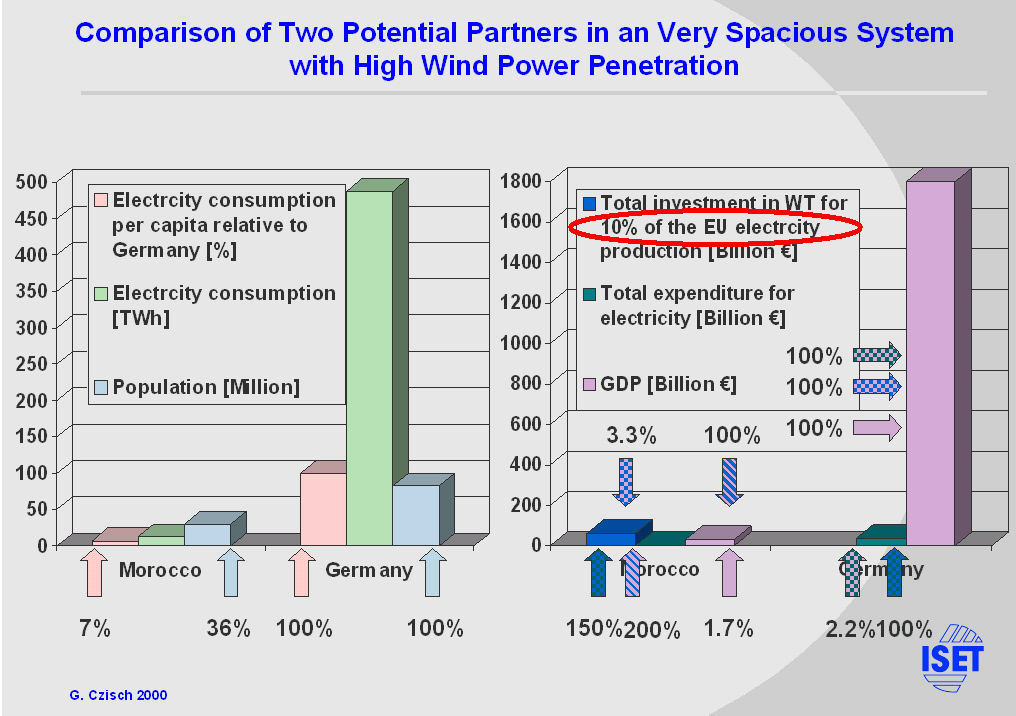
At the end of my speech I want to switch the point of view to an other aspect of the Extraeuropean option for an energy supply with wind power. I roughly want to sketch the idea to combine CO2 reduction and Development aid. Therefore I will compare two potential partners within a new electricity system.
Morocco and Germany:
So the decision for Europe would mean to get relatively cheap green electricity and for Morocco it could provide a development aid that lasts for some decades. |
|
Summary and Conclusion
|
|
On the slide you see all monthly time series of the potential wind power production within the selected regions as well as the result for combined production and the demand of EU & Norway. |

|
The change of the temporal behaviour of wind power production from different catchment areas can bee seen comparing its weighted standard deviations (STD/mean production). Here the results are shown for three different averaging times and three areas. The smallest only includes good wind sites in Germany and Denmark (DK-D).
In general the fluctuations rapidly decline with the size of the catchment area (see also REFERENCES[8] in the text version). For the simultaneous use of all regions mentioned the relative standard deviations are for all averaging times close to 30% of those within the area DK-D. The production is much smoother and the need of fast reactions to changes as well as of storage systems is significantly lower. |

|
Also other statistical figures significantly change with the size of the used catchment areas.
So it can recapitulatory be said that the time performance of wind power with increasing size of the catchment area becomes more and more balanced and thus more favourable for the electricity supply. |
|
The slide shows the duration curve of the demand in EU & Norway and the duration curves of the difference between wind power production and demand at 440 or 660 GW of rated wind power installed within all regions.
At the 660 GW case more than the total lack of wind power production could be covered engaging the hydro power produced from existing storage hydro power plants within the area considered (see the blue field). But today's rated storage hydro power of 95 GW is not sufficient to compensate all occurrences of missing production (see the shaded area within the blue field) and thus there must be other power sources (pump storages, biomass fired plants ….). |
|
The table shows the rated power, total storage capacity and annual electricity production of Storage Hydro Power Plants within the member states of UCTE and NORDEL. |
|
Here the duration curves for an other selection of wind sites including offshore sites at the European coasts is shown. Details can be found in the German articles Windenergie gestern, heute und morgen and Potentiale der regenerativen Stromerzeugung in Nordafrika
Worth mentioning is the relatively high minimum power of 12% found for the combination of Northern African wind power from land sites with European offshore power production. |