
Vortrag Lübeck 2006 - Übersicht
Aus Transnational-Renewables
| Lecture Magdeburg [2001,en], Vortrag Lübeck [2006,de], Lecture Barcelona [2008,en], Vortrag EWEA 2000 [2000,en] |
| Vorstellung regenerativer Energien: Biomasse, Windenergie, Fallwindkraftwerke, Geothermie, Wasserkraft, Solarenergie |
Wirtschaftlich realisierbare Stromversorgung für Europa un seine Nachbarn
- diese Folien zeigen eindrucksvoll, die Möglichkeit regenerative Energien.....
|
I my talk I will show that we can produce all our electricity from renewable sources. This would have a high positive impact on climate protection since today nearly half of the CO2 emissions are caused by electricity production.
In my talk I will introduce you to some the worldwide potentials for renewable electricity production. The techniques we will discuss are electricity production via solar thermal power plants and hydropower and finally we will focus on wind energy. For each of these options of power generation I am going to point out the characteristics with regard to their specific temporal behaviour and the costs to be expected. We will see that the temporal behaviour significantly changes with the size and the selection of the catchment area used for the power generation. We will also touch on the topics of backup and storage needs, the subject of grid capacities and of cause the question of electricity costs. After this we will come to economically viable „Scenarios for a Future Electricity Supply“ * based 100% on renewable energies. It will be shown that a change to a totally renewable electricity supply is neither a technical nor a economic problem but mainly a political task.
Szenarien zur zukünftigen Stromversorgung - Kostenoptimierte Variationen zur Versorgung Europas und seiner Nachbarn mit Strom aus erneuerbaren Energien https://kobra.bibliothek.uni-kassel.de/handle/urn:nbn:de:hebis:34-200604119596 Low Cost but Totally Renewable Electricity Supply for a Huge Supply Area http://www.iset.uni-kassel.de/abt/w3-w/projekte/LowCostEuropElSup_revised_for_AKE_2006.pdf |
|
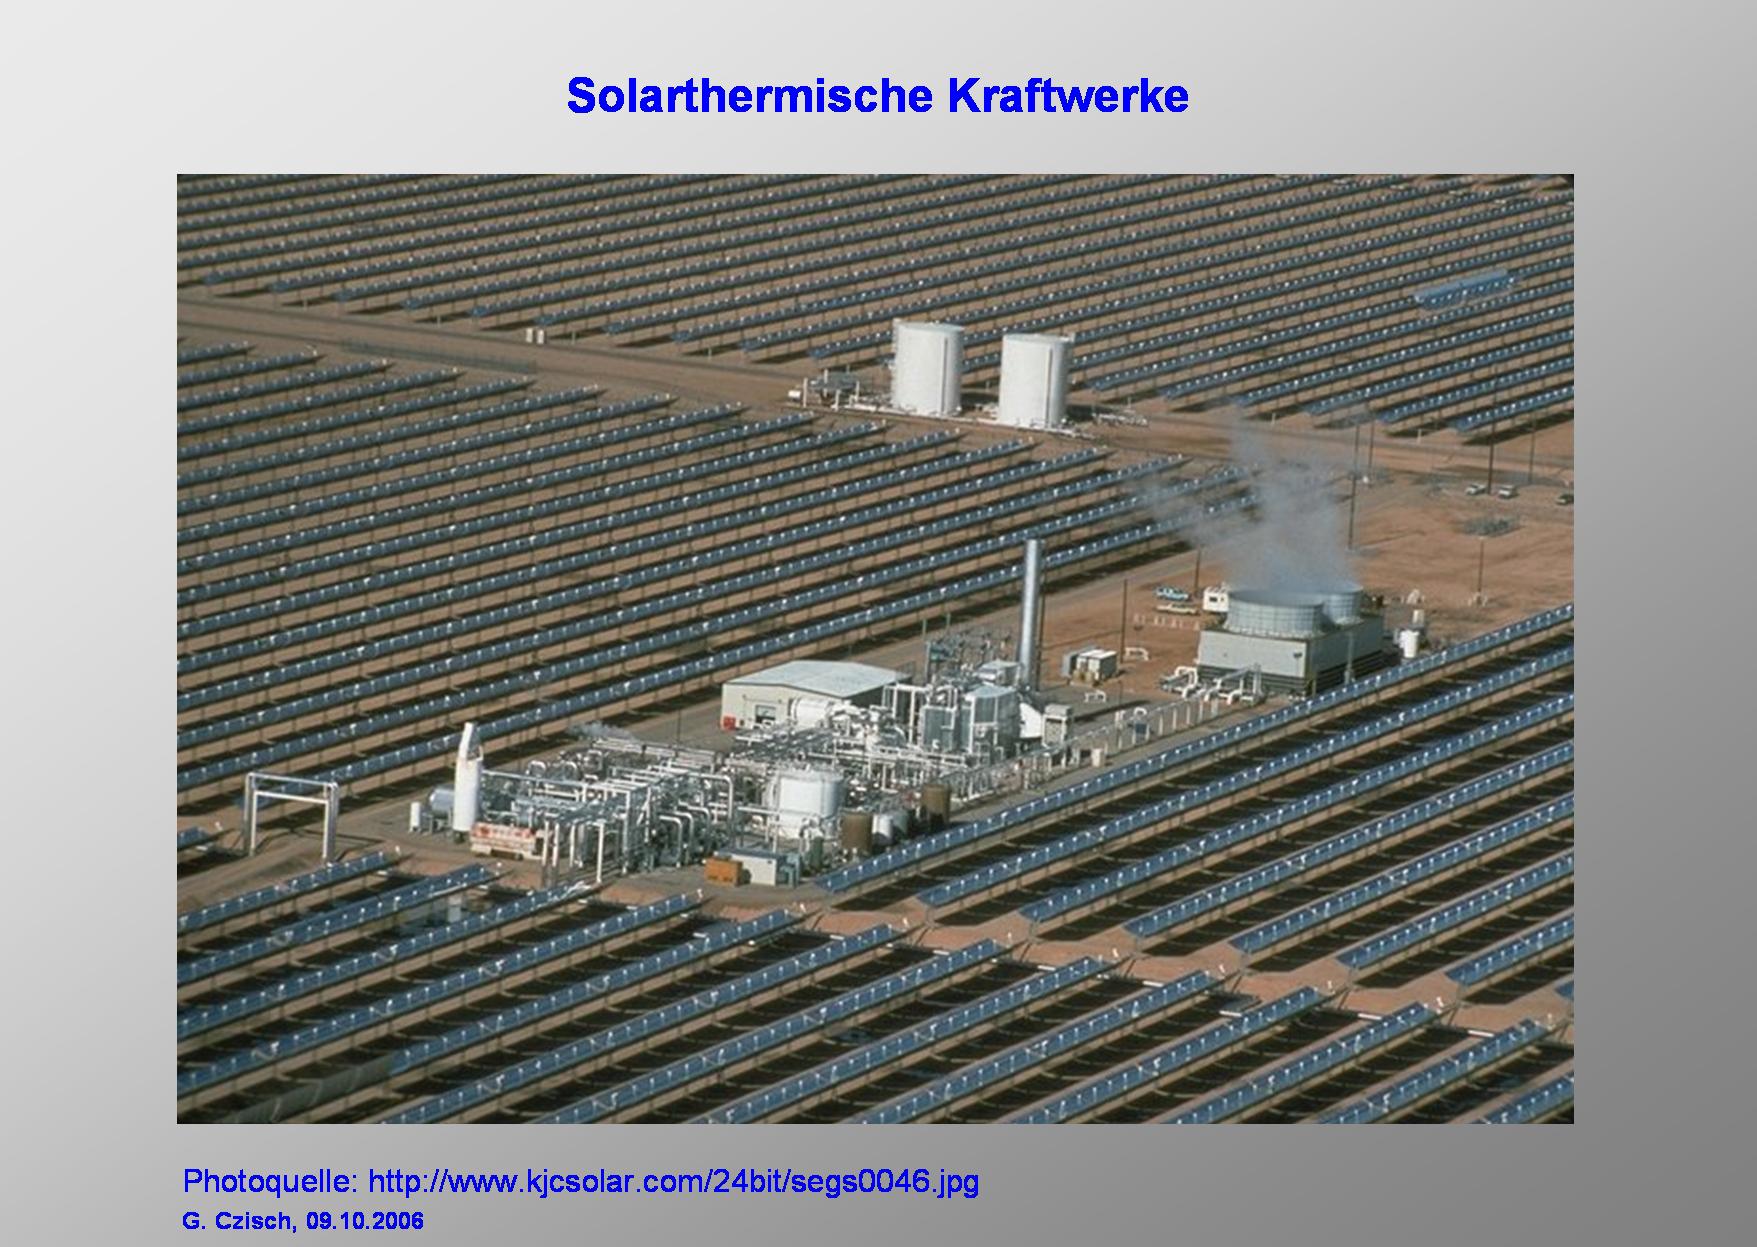
Here you see a view of a solar thermal power plant which leads us to the potentials of this kind of electricity production. The direct solar radiation is concentrated in parabolic troughs to heat up a fluid that is used to power a conventional thermal power plant. Dependent on the design of the power plant the heat is used with an efficiency between approx. 32 and 38 % to produce electricity. |
|
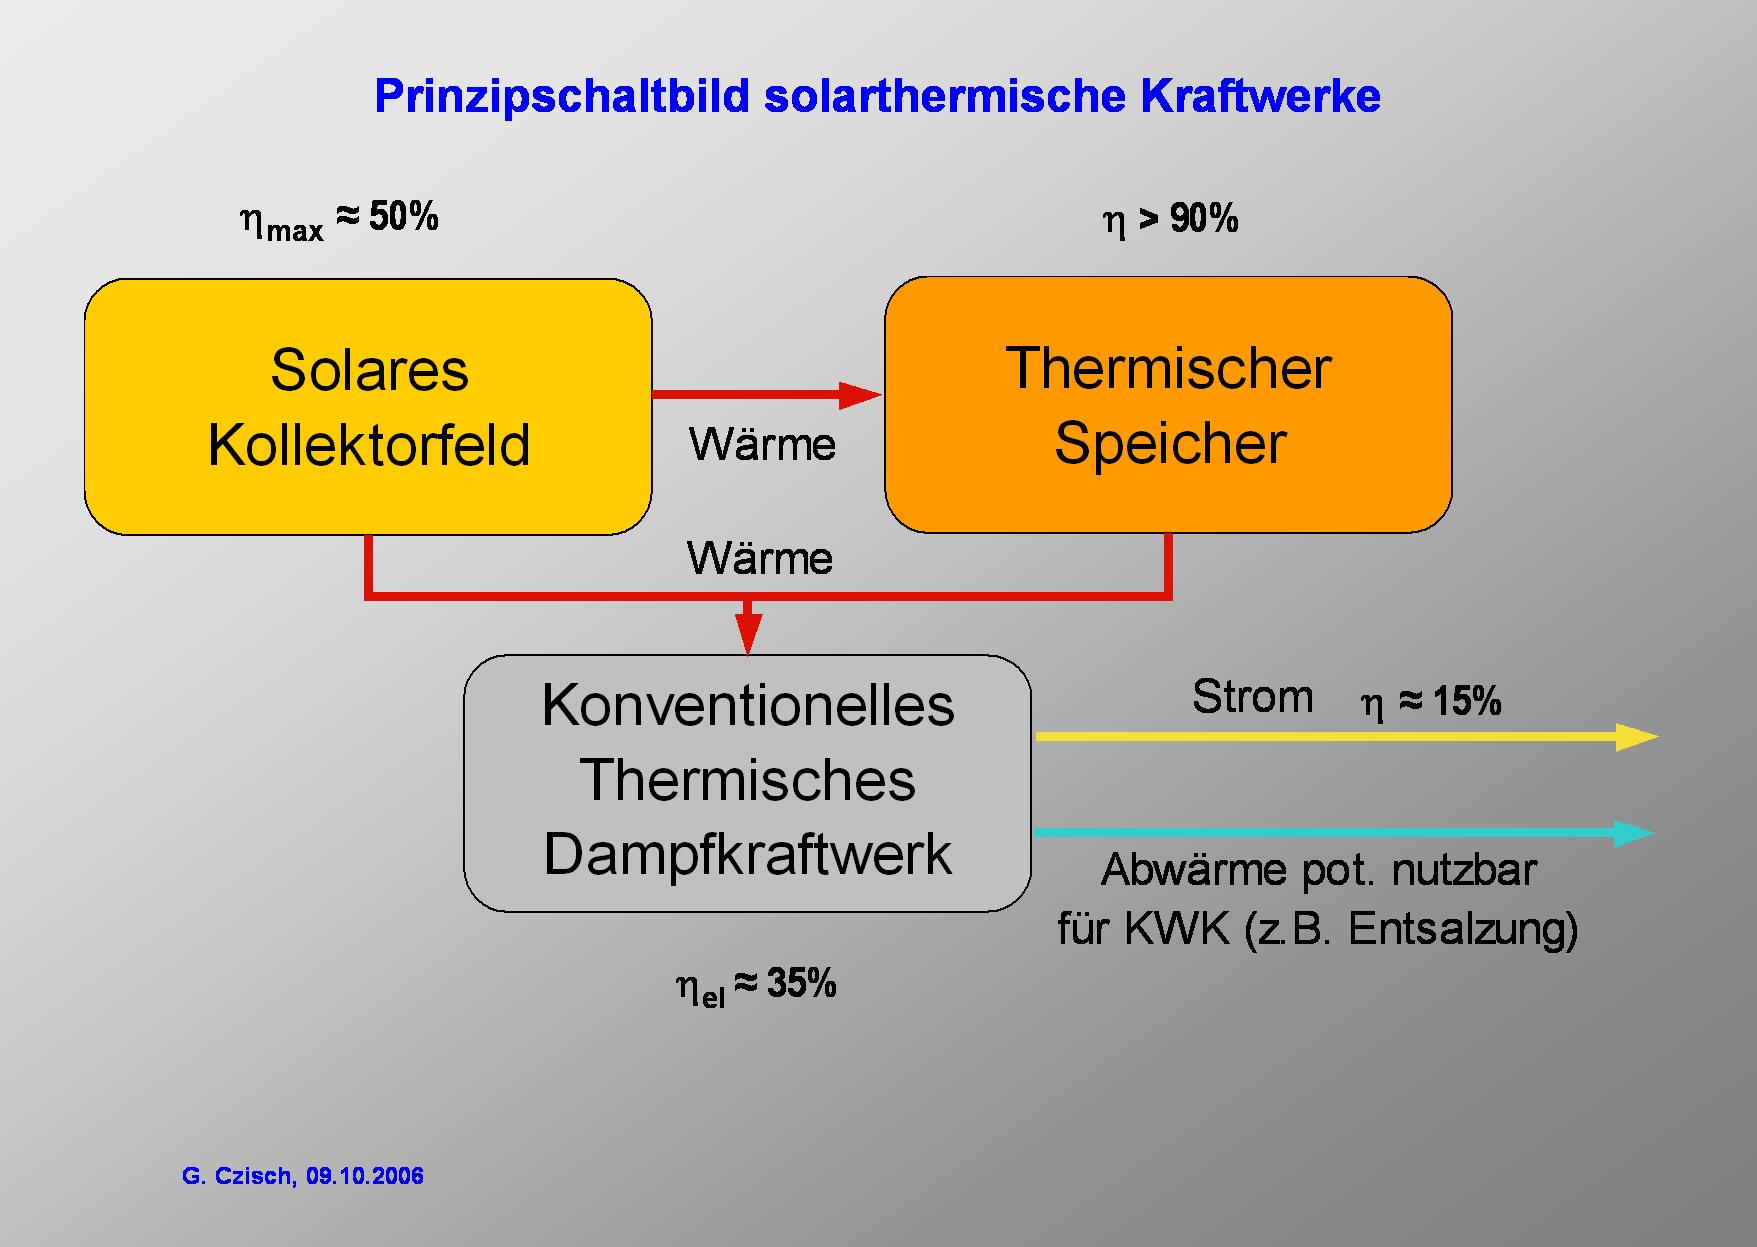
The solar heat can either directly be fed into the conventional thermal power plant or stored in a thermal storage to be used later (e.g. after sunset) to produce electricity. |

|
Here the potential heat production of the solar field of a SEGS power plant is shown. Very good conditions are found in the Sahara where the potential electricity production is more than 500 times the electricity consumption of the EU member states. |
|
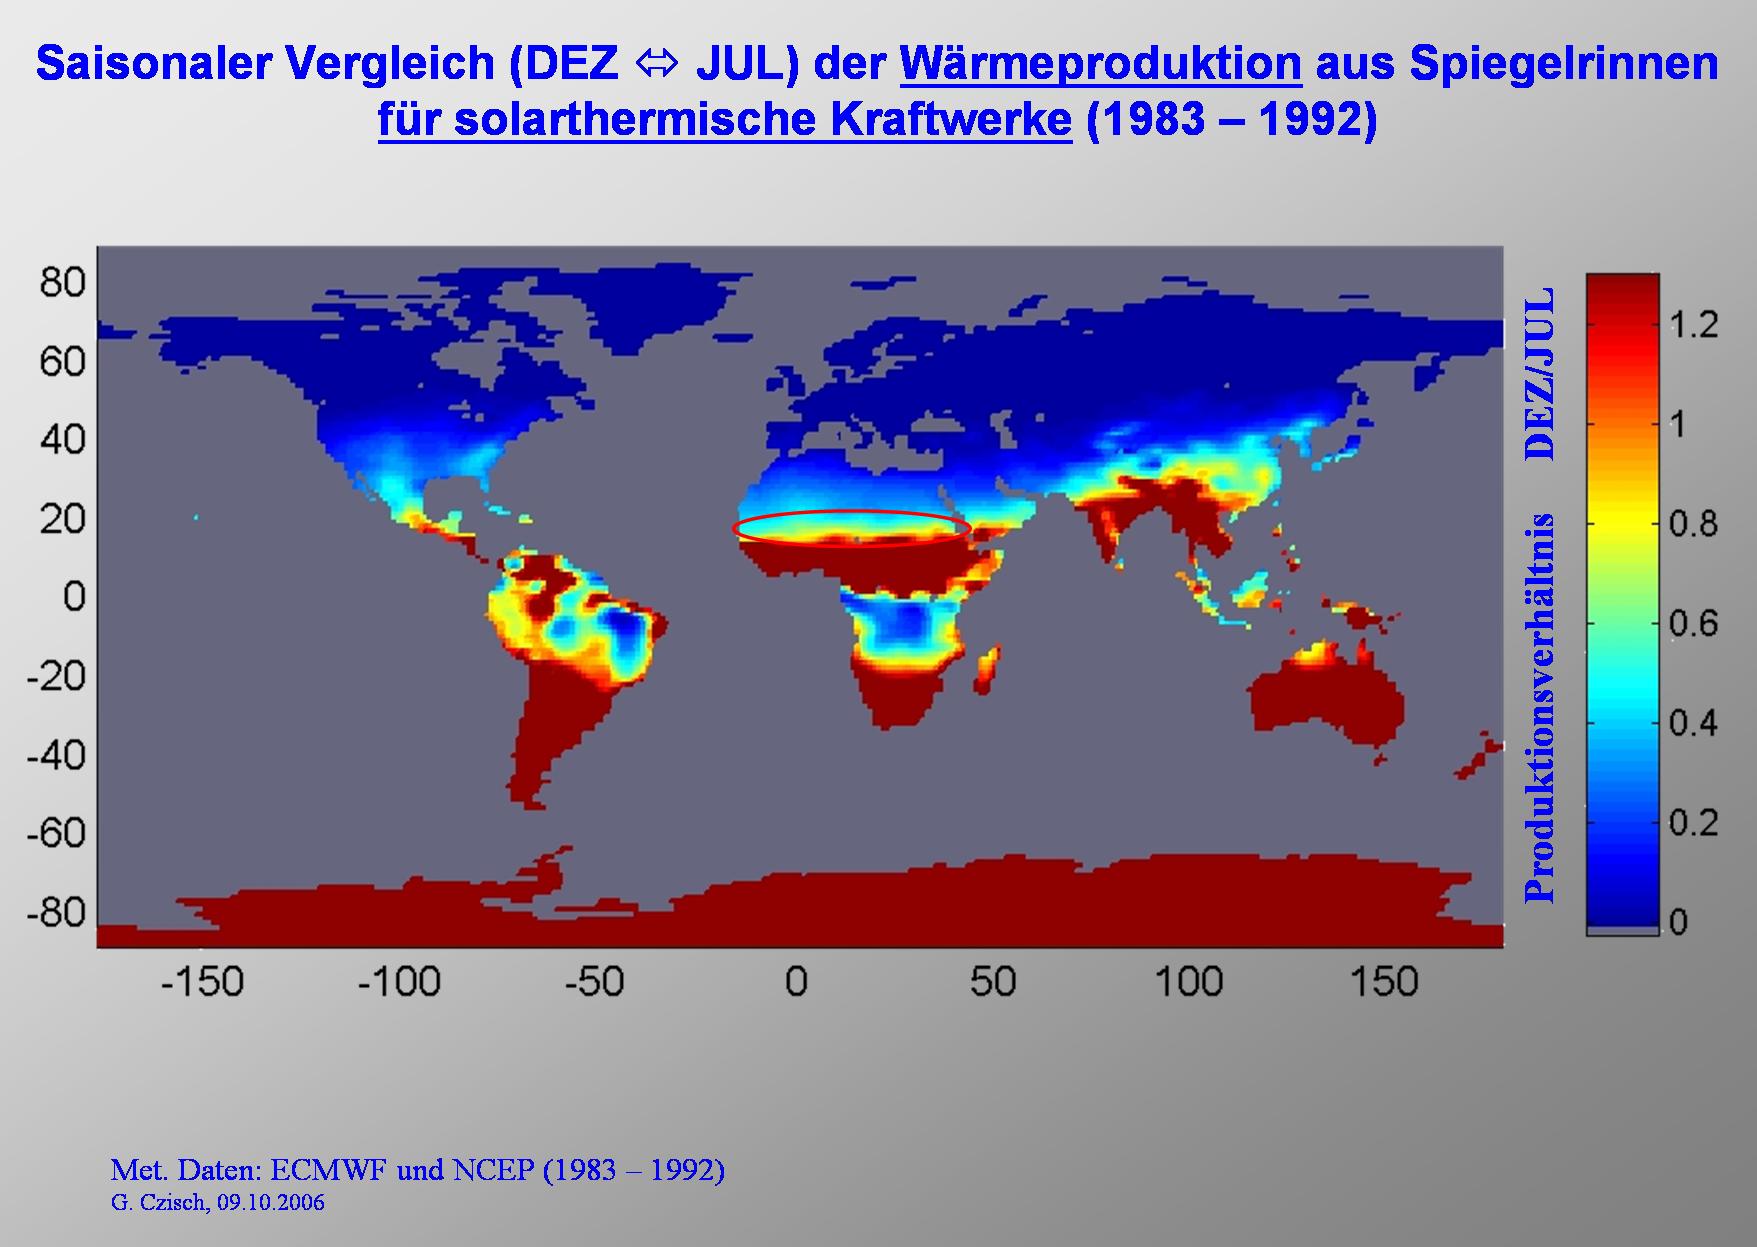
The seasonal variation of power production from SEGS power plants is significantly smaller at lower latitudes.
On this slide you can see for example the ratio between the average electricity production in December and July. As it is the case for the PV electricity production, at the southern Sahara we find that the production only changes slightly over the months while the variations increase much stronger going to higher longitudes. |

|
Since the electricity production with solar thermal power plants is – as we will see later – is relatively cheap at good sites we can also think at transmitting the electricity from Africa to Europe. |

|
But the European electricity network within and especially between the countries is to weak for high wind power penetration ore huge amounts of renewable electricity from solar thermal power plants. This is also true for the connection to Africa.
For example the Net Transfer Capacities from Morocco to Spain with its 400 MW and the 1100 MW from Spain to France would not allow high power transfer even if the capacity soon is enlarged to 1400 MW between Morocco and Spain. But there is a solution. High Voltage Direct Current Transmission (HVDC = HGÜ) is a technology used since many decades for transmission of huge amounts of electricity over far distances at very low losses and low costs. |

|
With the underlying economical assumptions based on today's technologies and prices shown in the upper right tables the costs of solar thermal electricity production are calculated for some selected sites. The results are listed in the table at the left side.
Using today's High Voltage DC (HVDC) technology to transport the electricity to Europe (e.g. Kassel GER) the costs of electricity would even for the farest distance mentioned only increase by 30%. The underlying economical assumptions for HVDC technology are shown in the lower right table. The costs of electricity in Kassel do not seem to be very unreasonable. The option to import solar thermal electricity from Northern Africa to Europe becomes even more interesting, if the investment costs for solar fields, the most costly part of SEGS power plants, will reduce. An reduction to roughly 50% of the today's field costs is expected as soon as a capacity of 7 GW of SEGS is erected world-wide. This will reduce the costs of electricity in Kassel to approx. 60% or below 6 €ct/kWh. |
|
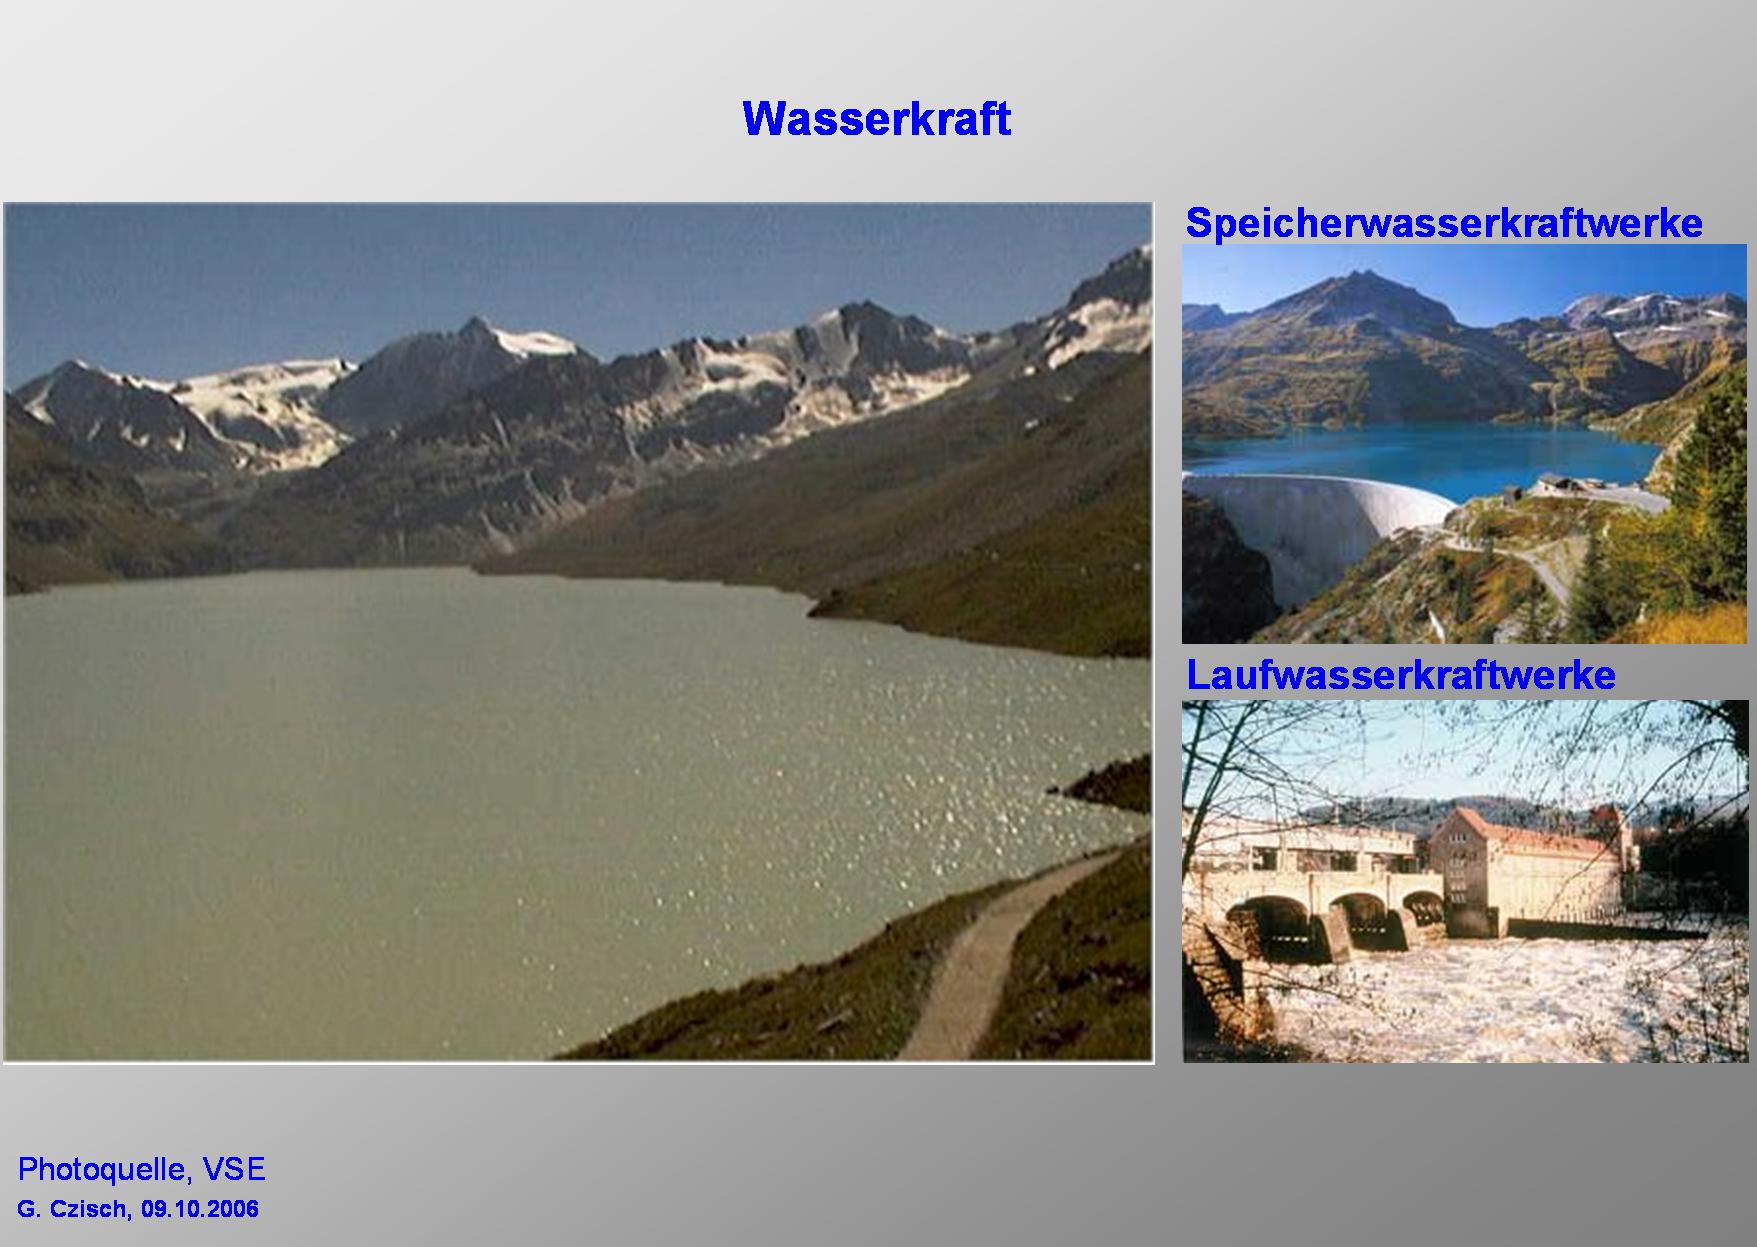
Now we come to hydropower.
Here it is worth to distinguish between two types. The river runoff type uses the water at the time it runs down the river and normally has no or just very little storage capacity. The storage type sometimes can store the water which is running into its reservoir for many months (see following table). So this kind of power plant decouples runoff and electricity production and thus gives the degrees of freedom necessary to be used as back up to balance the variation of other production facilities and of the demand. |
|
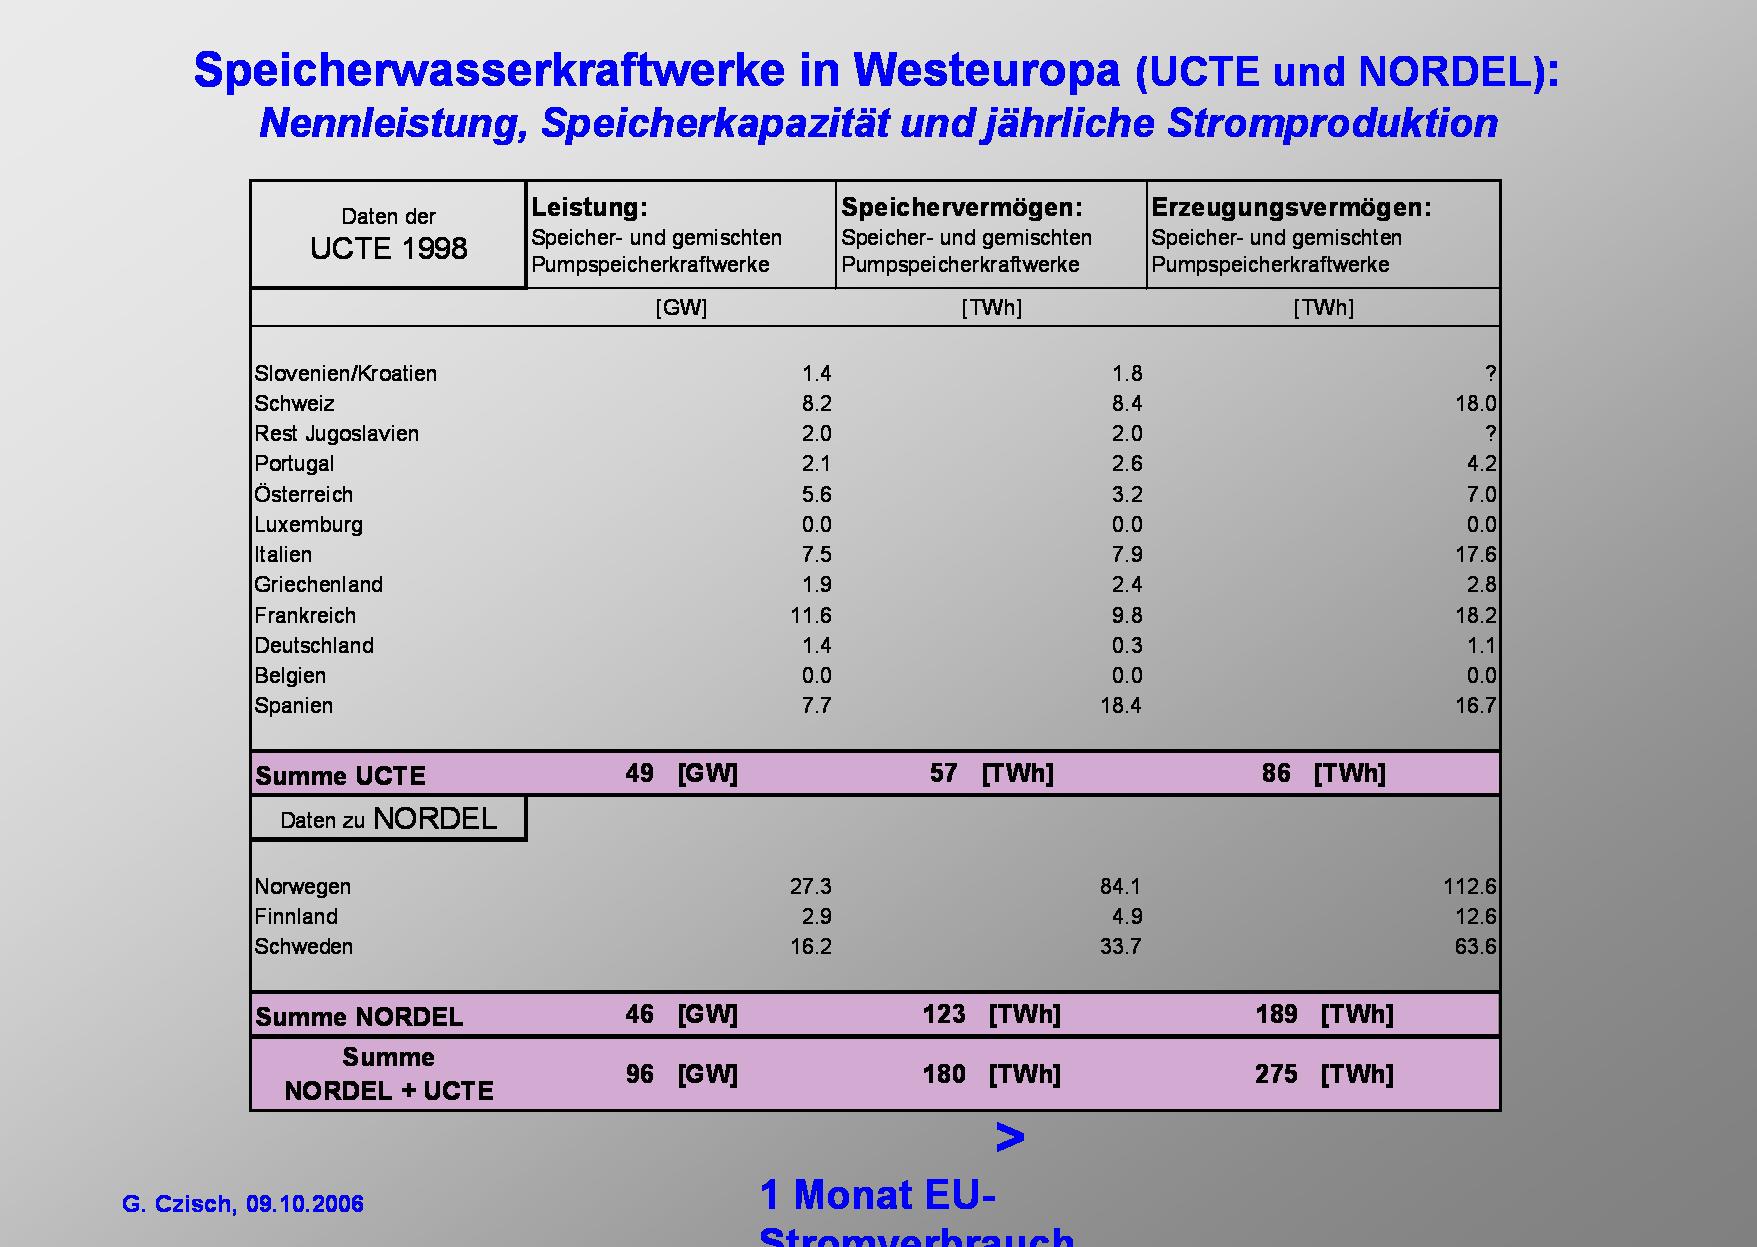
This Table shows the rated power, the storage capacities and the annual energy production of Storage Hydroelectric Power Plants in Western European Countries. The storage capacities are close to 10% of the total electricity production within all the member countries of the EU-15. |

|
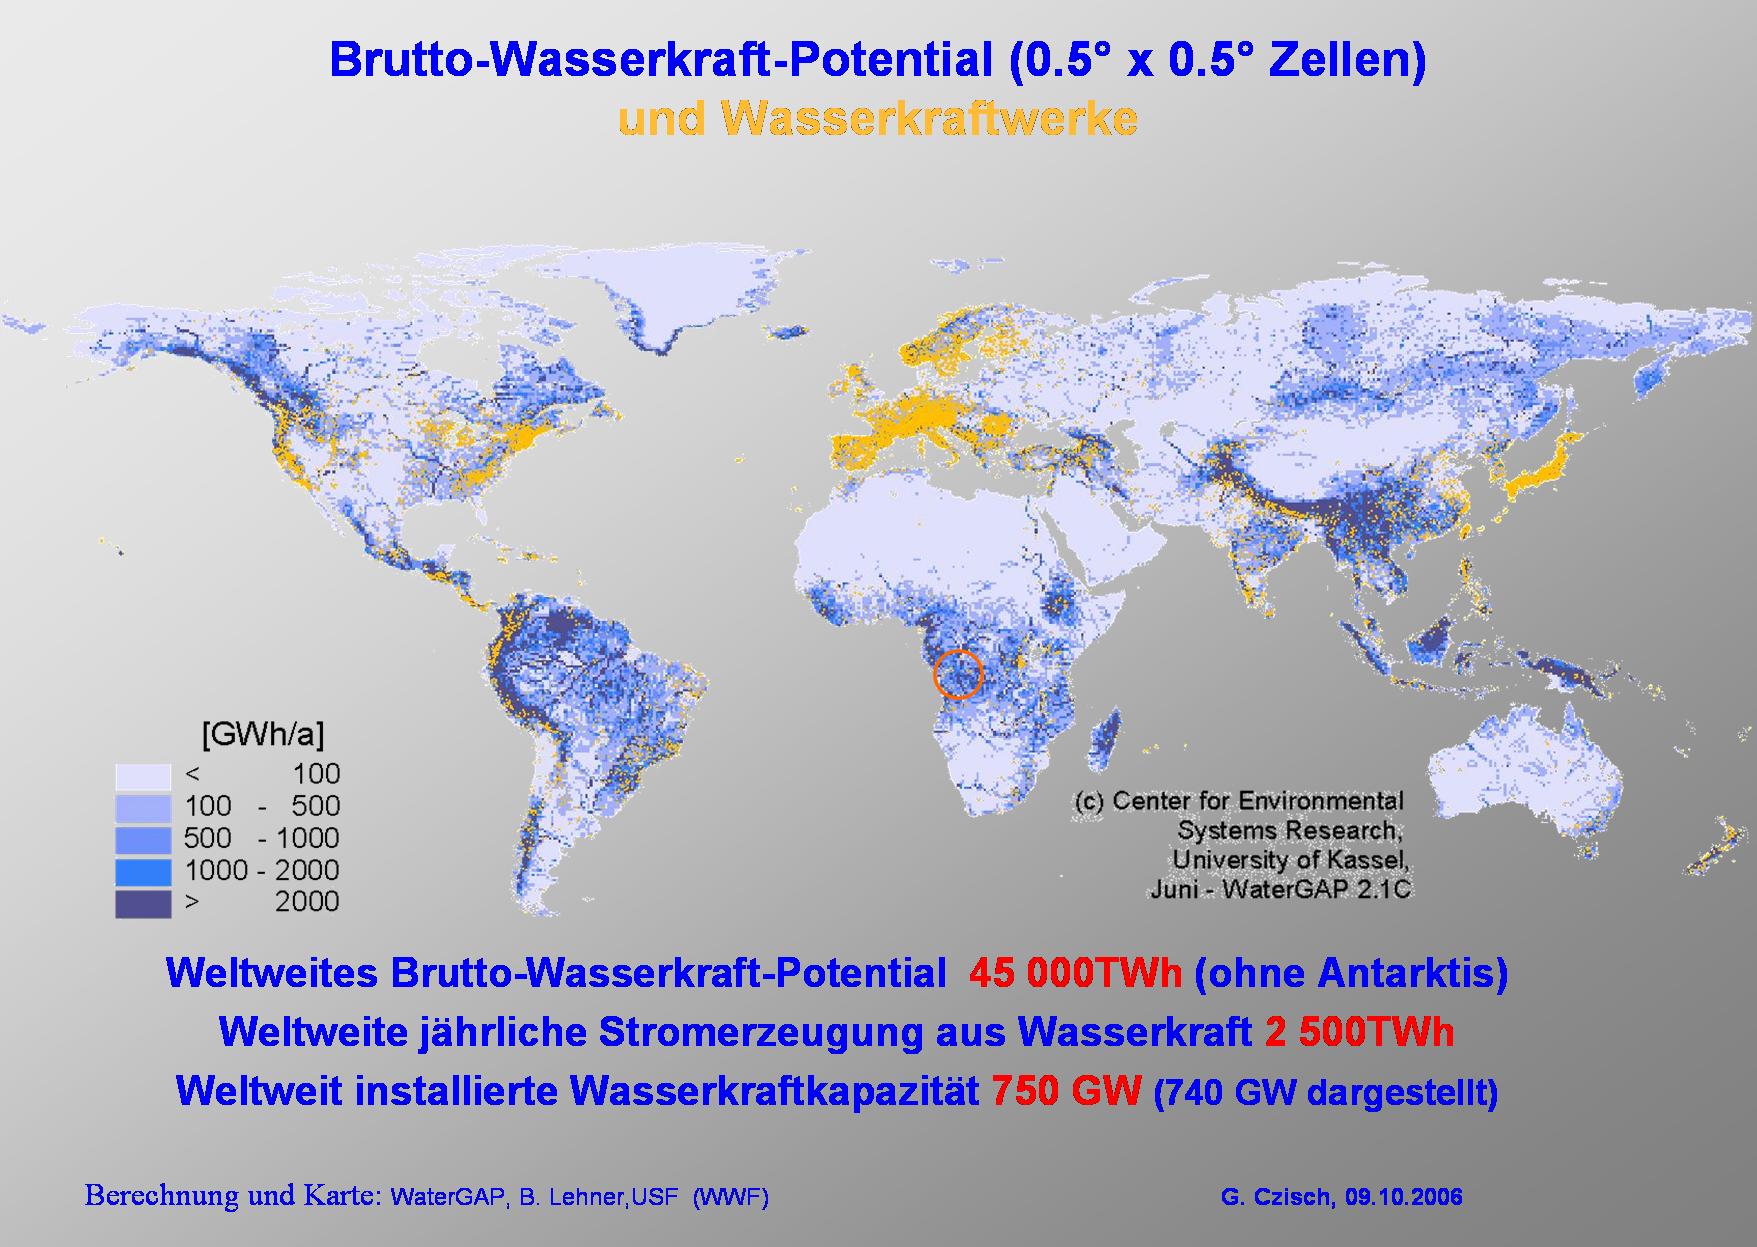
The best hydropower potentials are found in mountainous regions with high annual precipitation. |
|
Especially the industrial countries already use a considerable part of their hydropower potentials.
At Inga at the river Congo there is probably the location where the biggest hydropower plant world wide could be erected. |
|
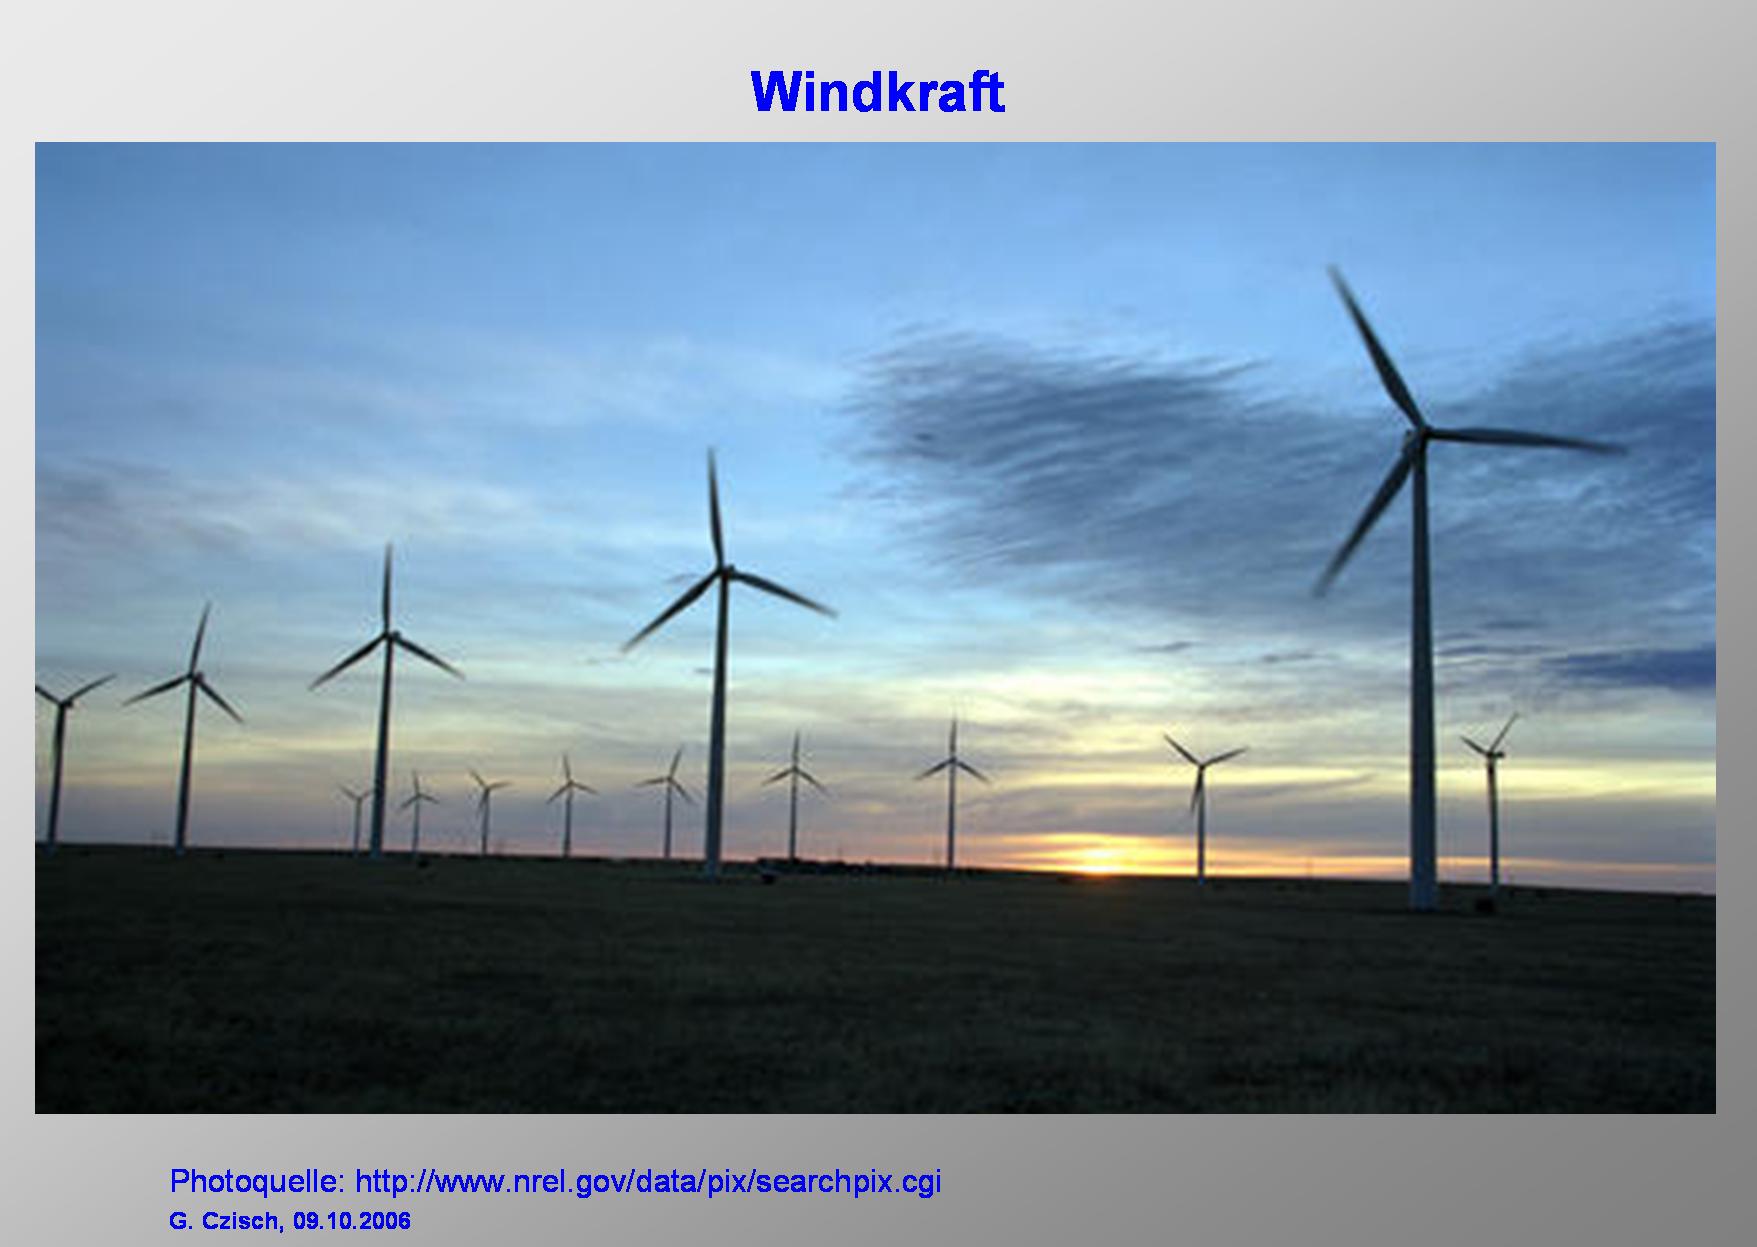
Now we come to wind energy. |
|
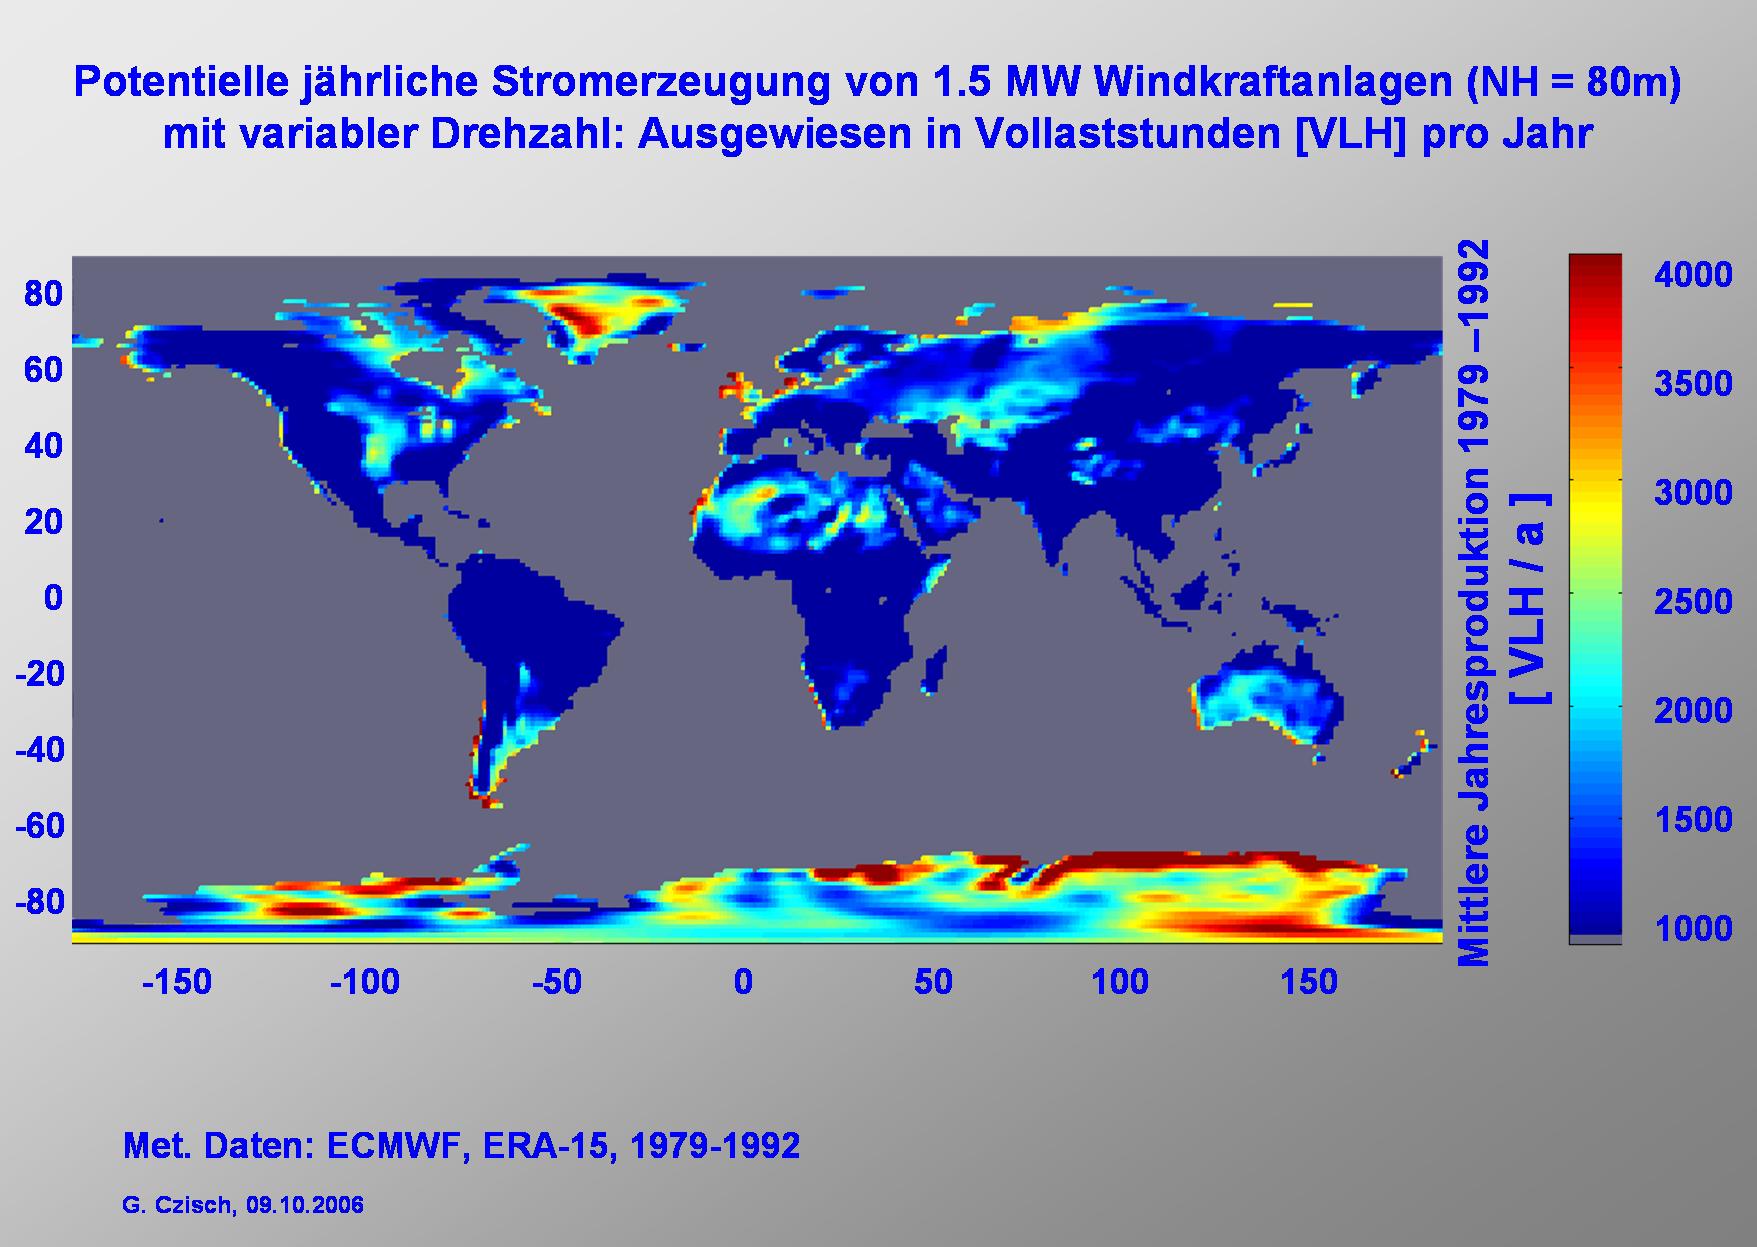
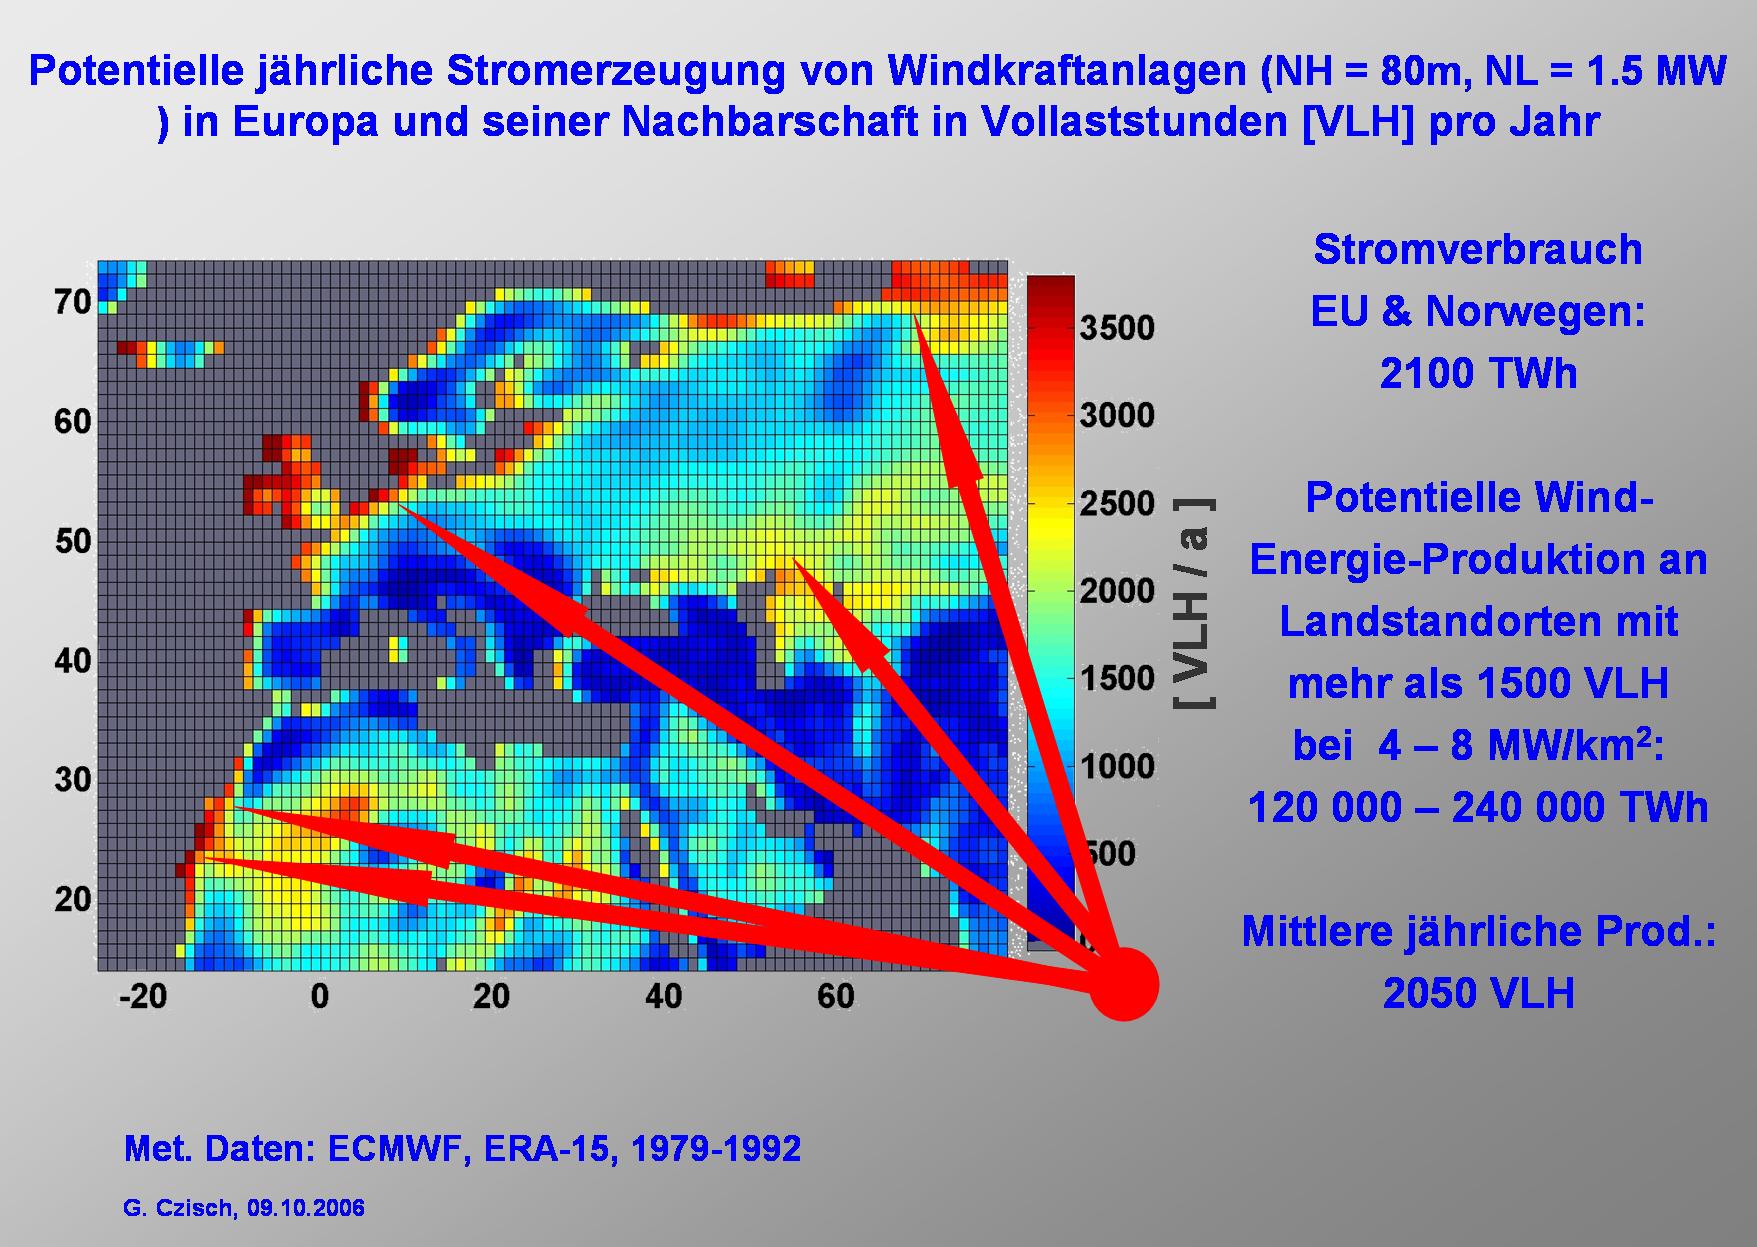
Here you can see the potential production of wind energy calculated from Data of the European Centre for Medium Range Weather Forecast expressed in FLH. Europe itself has good wind conditions. But its use is limited by the high population density. In a belt 4000 to 5000 km away from Kassel which is right in the middle of Germany there are also very good wind conditions and in most of the areas the population density is 2 orders of magnitude smaller than for example in Germany. |
|
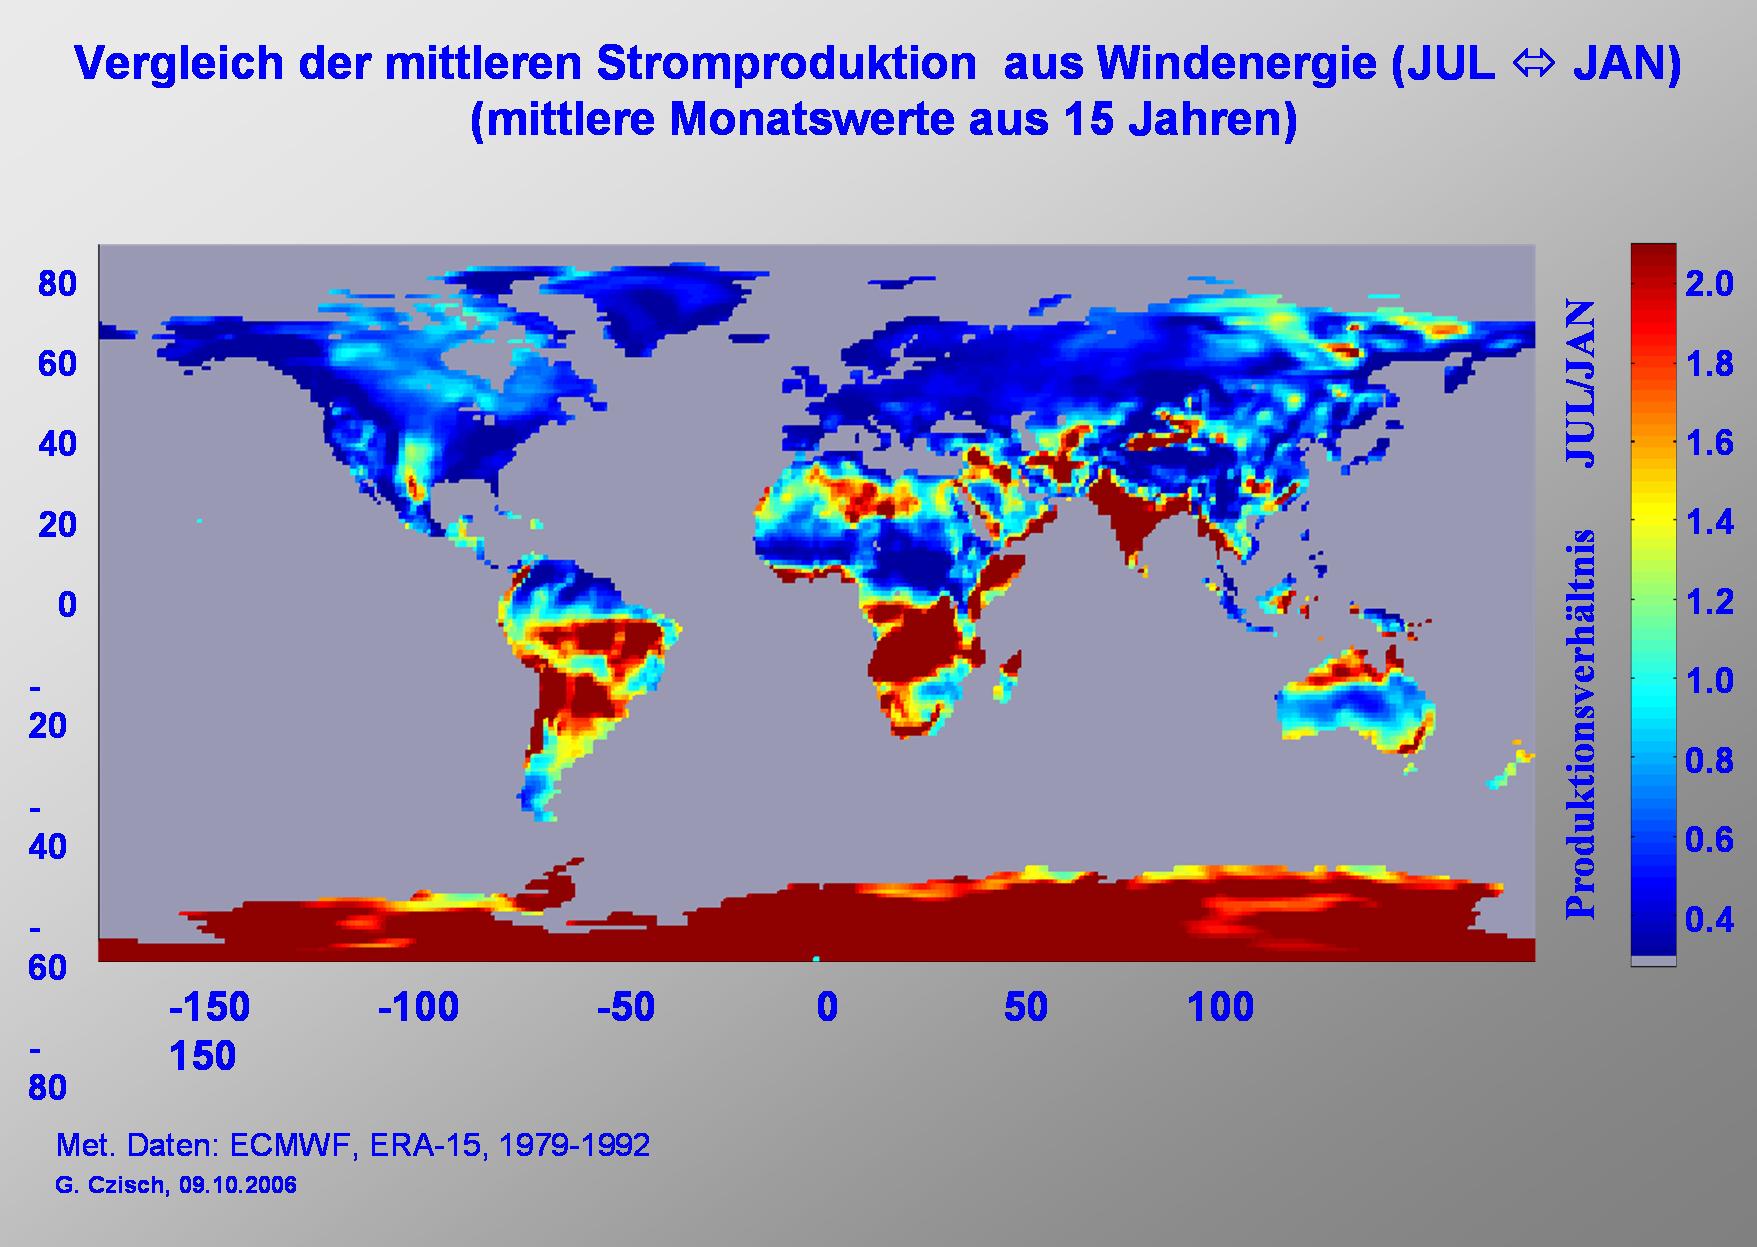
The seasonal variation of the potential power production from wind energy shows significant differences in different regions. On this slide you can see for example the ratio between the average electricity production in July and January. We see, that Europe is a typical winter wind region with maxima in winter and minima in summer. While for example at the Saharan west coast we find maxima of the production in summer. In some other regions the production in July and January are quite similar. So the idea of selecting the regions in order to get the best match of production and electricity consumption suggests itself. |

|
If we now zoom in and have a view on Europe and its neighbourhood we find the potential production within the shown area only considering Sites with more than 1500 FLH (this is about 40% of the land area shown) is about 100 times higher than the Need of the European Union and Norway or 50 times the electricity consumption of the whole area. (If the best wind sites within the area – according to the ECMWF data used – would be selected till the annual production is equivalent to the annual electricity consumption in the area shown there must be installed wind energy converters (WEC) at roughly 0.4% of the land area shown. About 1% of this area or 0.004% of the total area would then be covered by streets and other infrastructure for the WECs. This is a relatively small fraction it compared e.g. with the area used for different kinds of infrastructure today. In Germany the fraction is about 6% of the total land area which is about 1500 times as much.)
It is possible to be quite selective and choose only the better regions. As an example I selected the following.
To use these potentials we have to have high transport capacities. |

|
Now we look closer to the five selected regions.
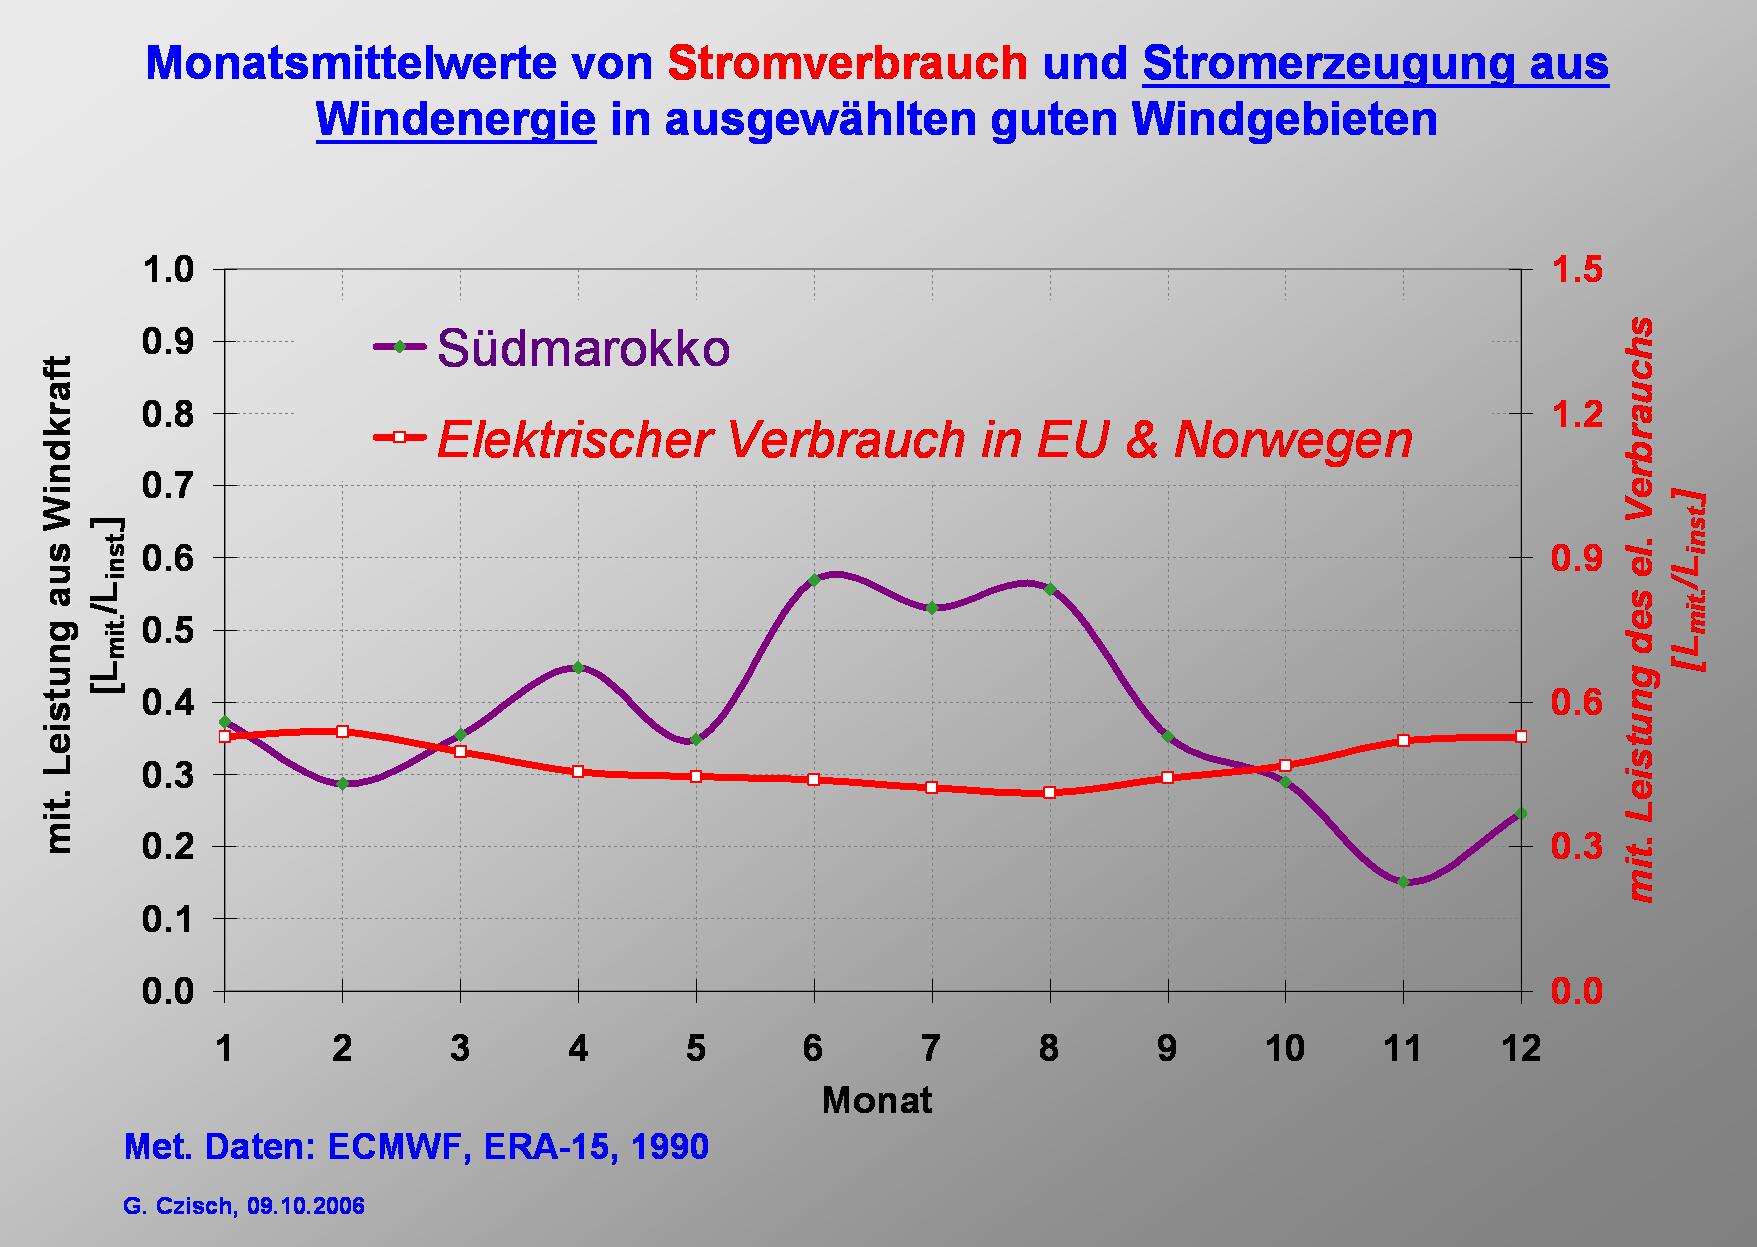
Comparing the monthly mean wind power of the selected European regions and the Demand of the EU & Norway one can see that the fluctuations of the production varies much more than the demand. Europe is a typical winter wind region with maxima in winter and minima in the summer month. |
|
Also the monthly means in Southern Morocco vary much more than the demand, but it is a passat wind region with summer maxima. |
|
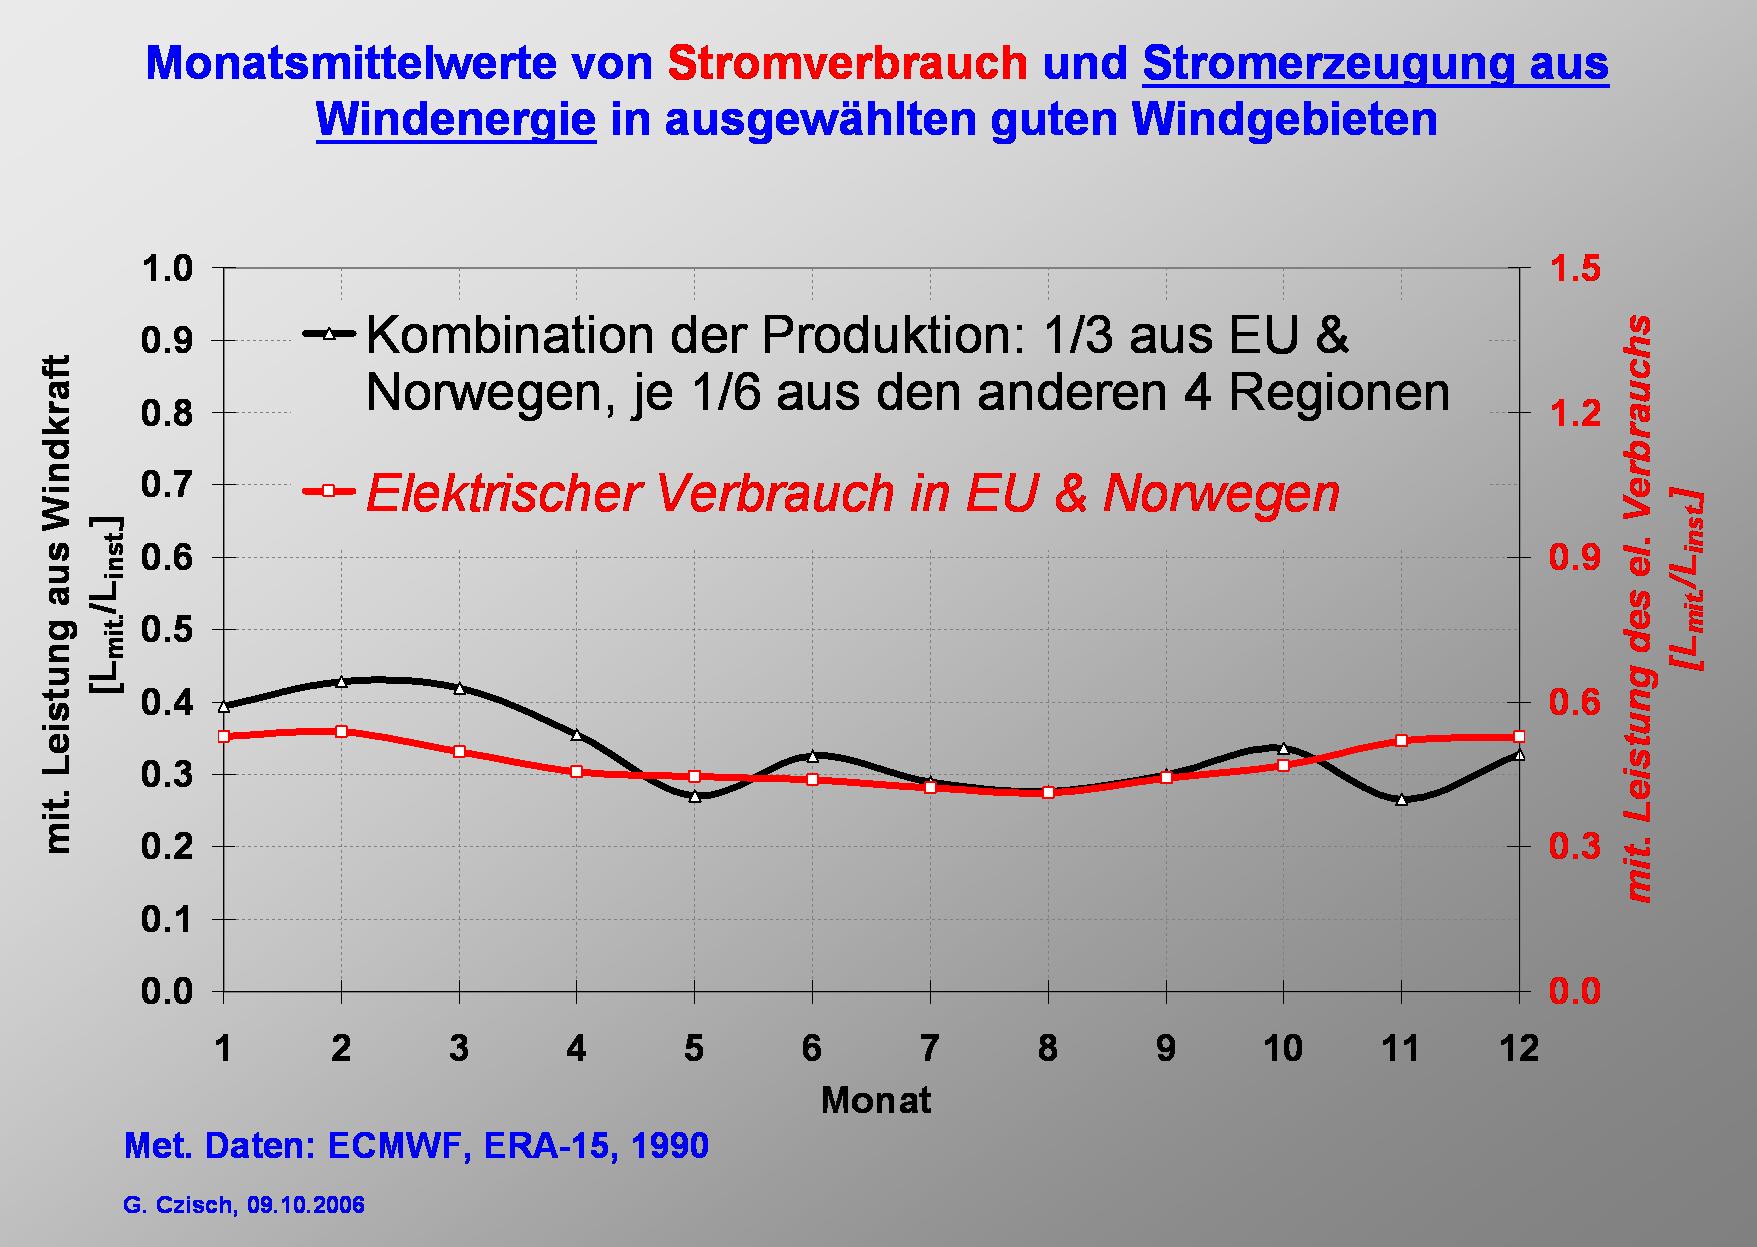
It is obvious that the use of simultaneous production in different regions can much better fit the demand.
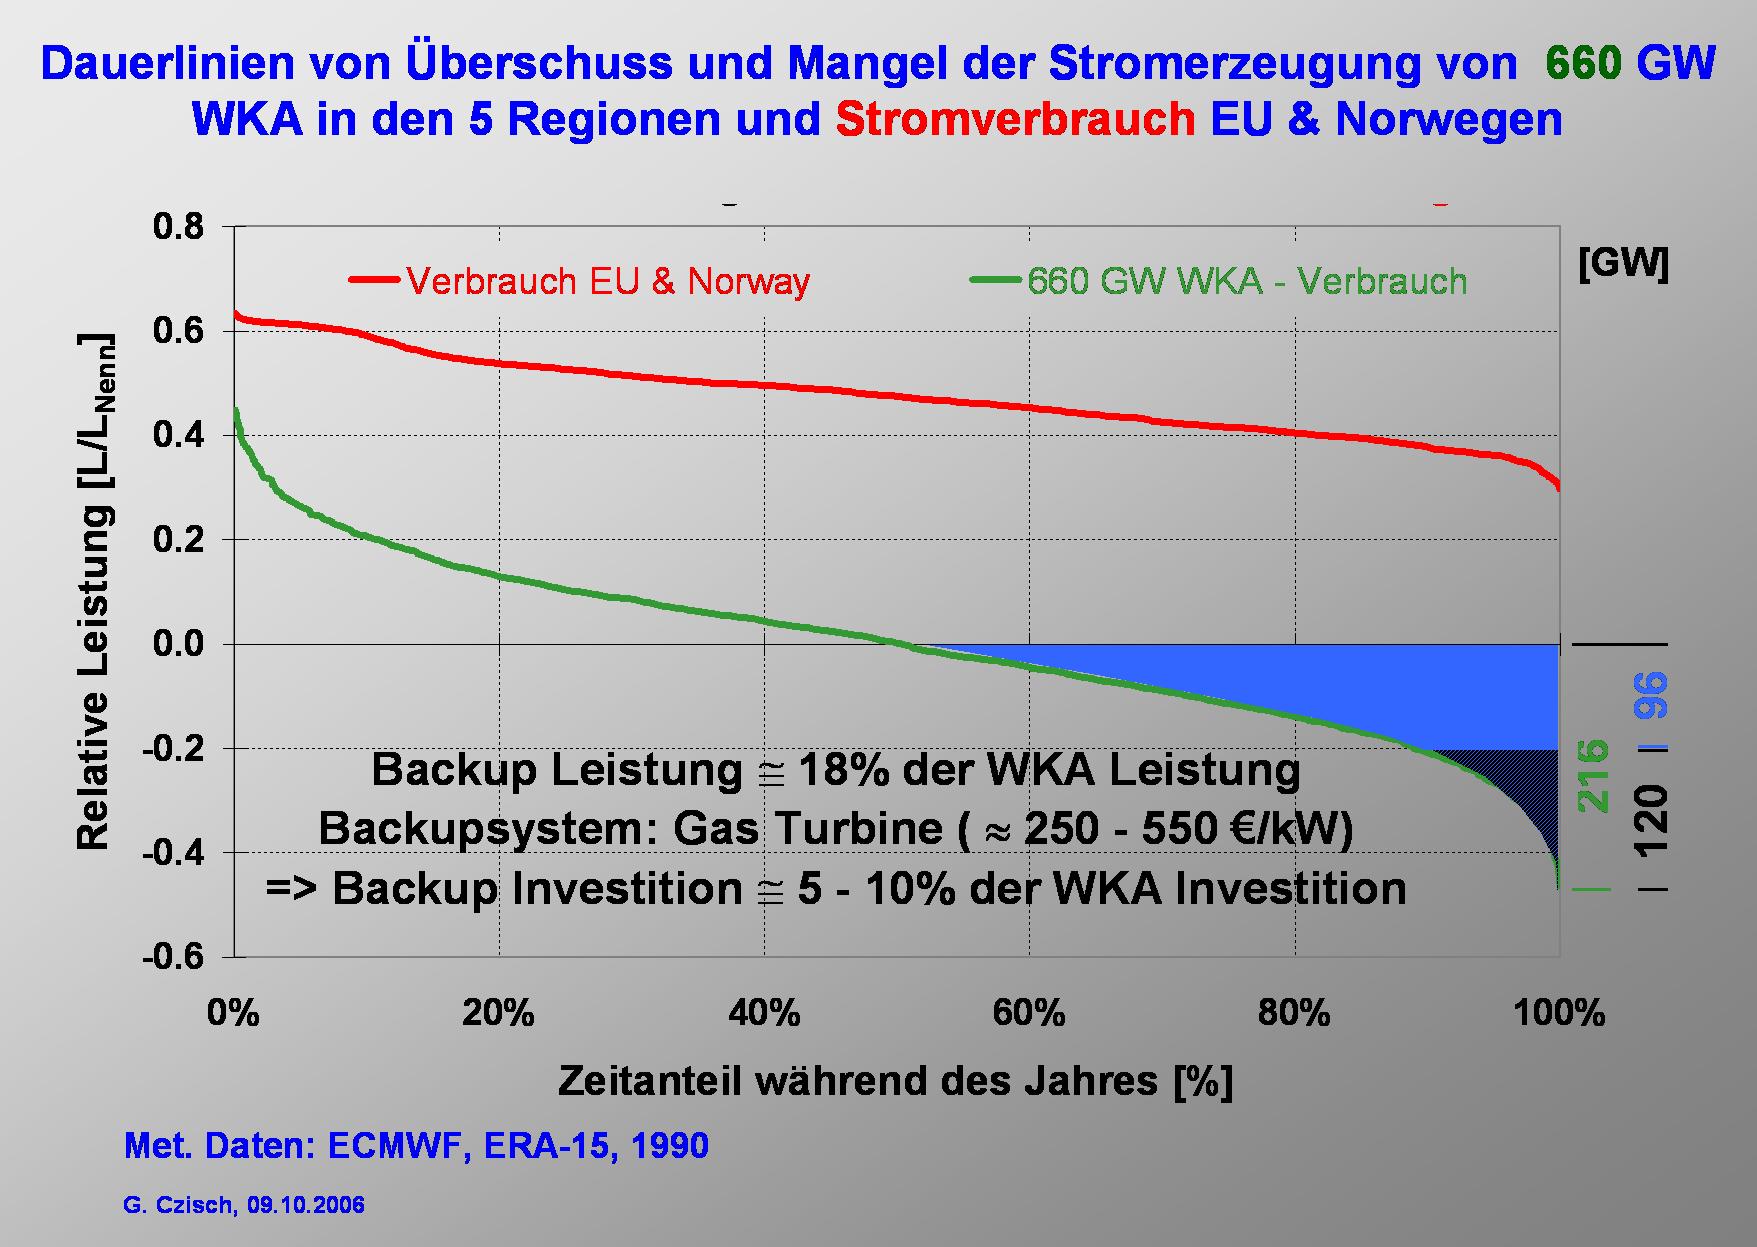
This shows the black line which represents a combination of of the five selected regions. But not only the long term behaviour changes with the size and selection of the catchment area. Now let us consider we produce the equivalent of the demand from wind Energy. For the demand EU & Norway we need to install 660 GW to within all regions. |
|
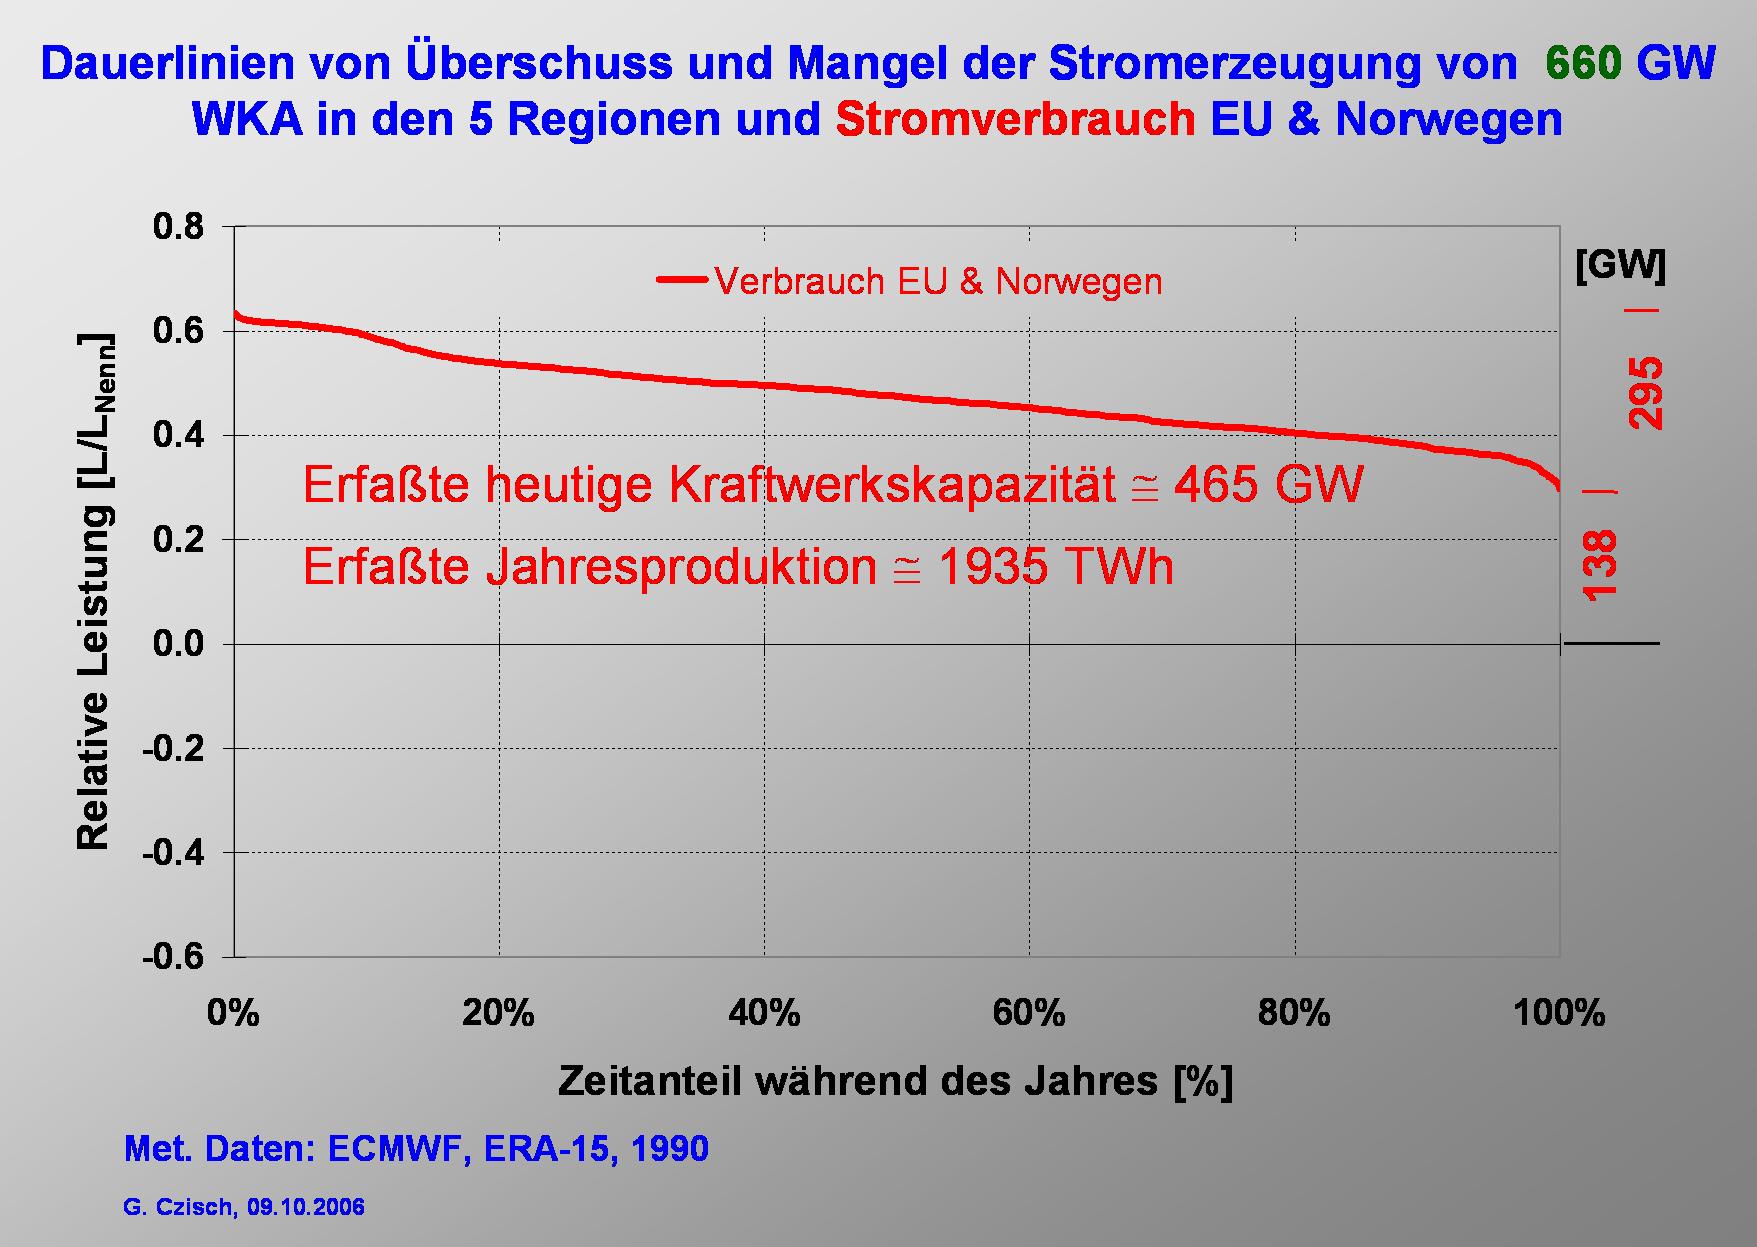
Following this simple example I would like to illustrate the influence of a combined production of electricity at the selected 5 regions shown before.
The duration curve of the hourly electricity consumption depicted in the slide represents a total rated power of 465 GW and a demand of 1940 TWh. The maximum power demand is 295 GW, the minimum about 140 GW. |
|
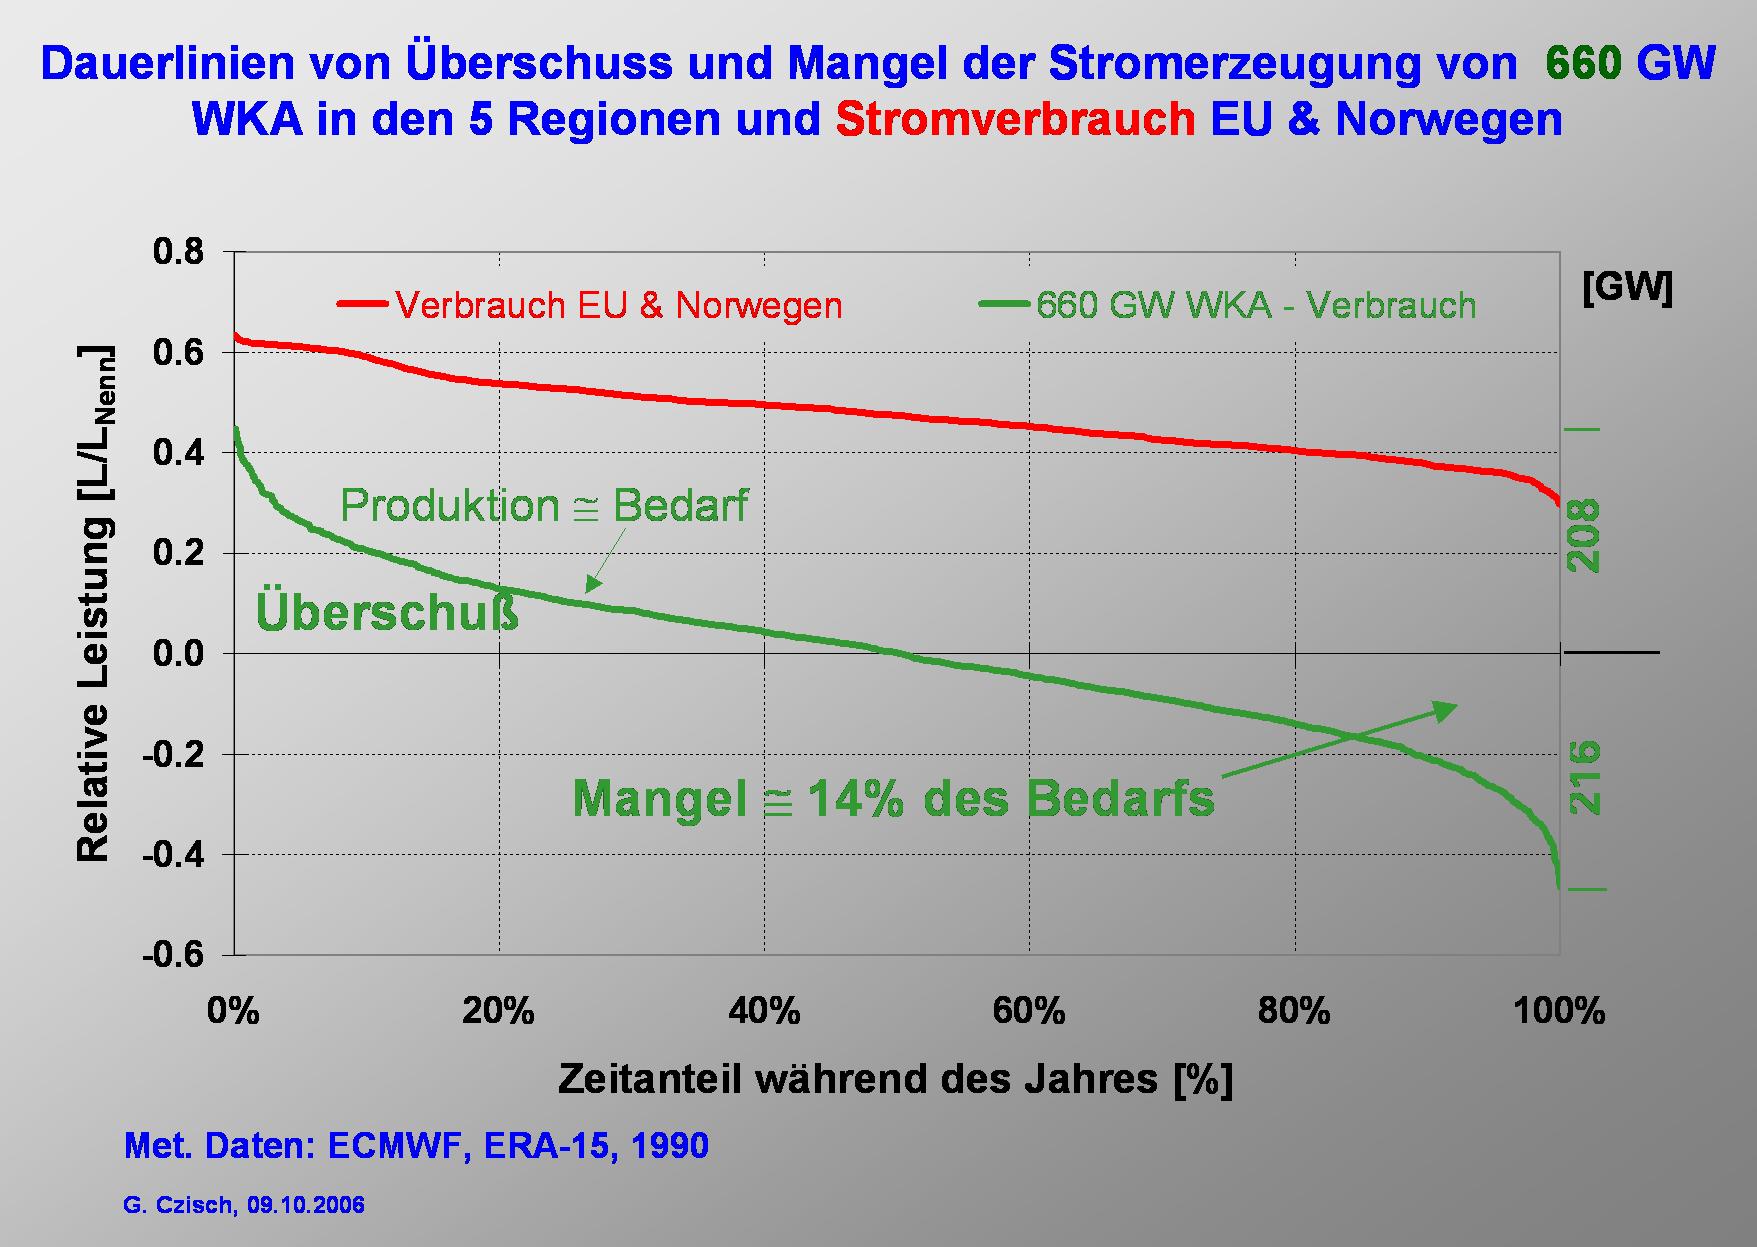
Now we ask the question: What happens if we produce as much electricity from wind energy as the annual consumption.
The duration curve of the difference between wind power production and demand is shown in the green line. The maximum power surplus and lack are each roughly 200 GW. The lack of energy amounts to 14% of the demand. |

|
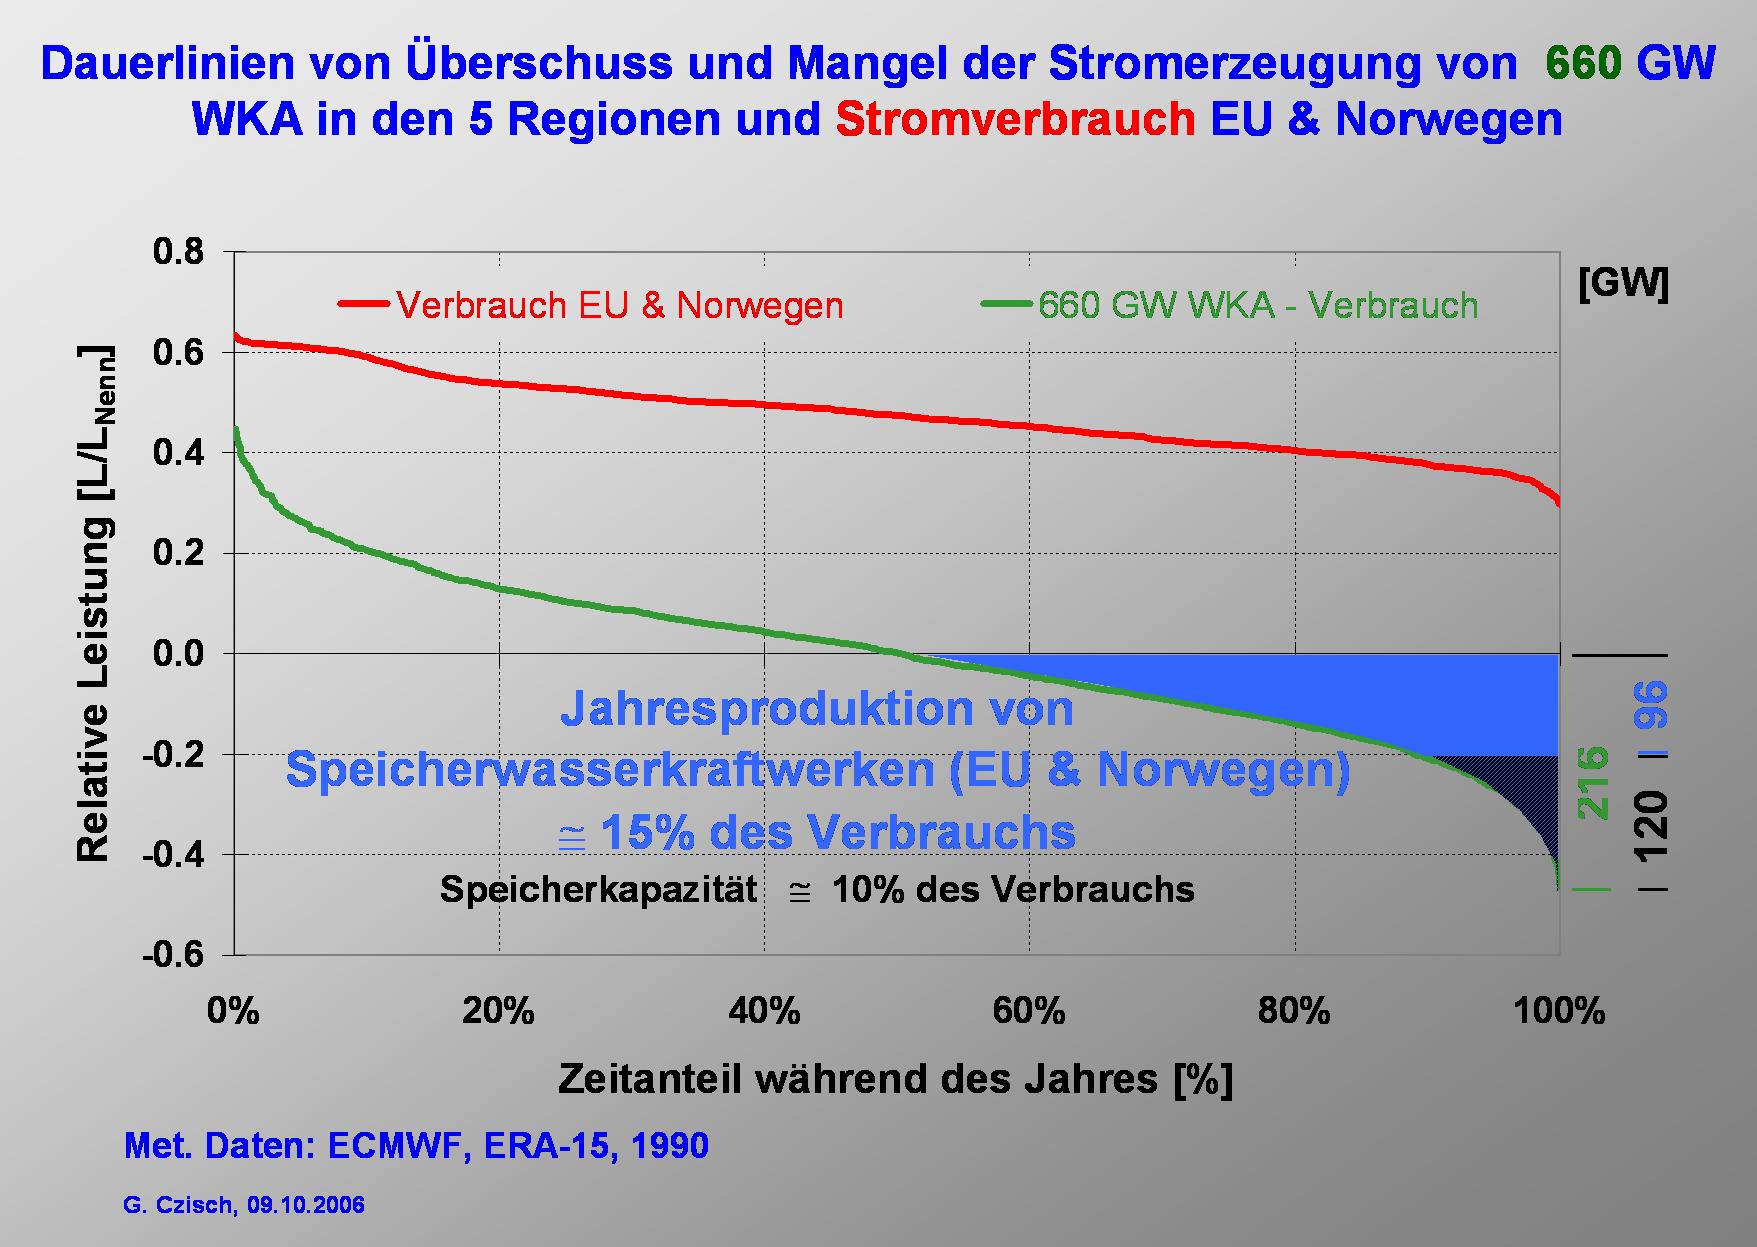
In Europe hydro power storage systems exist with relatively high rated power and storage capacities. The annual production of the storage hydropower within our supply area is 15% of its demand. So it is slightly higher than the lack of energy from the considered wind power production and so more than enough to compensate the lack of energy. |
|
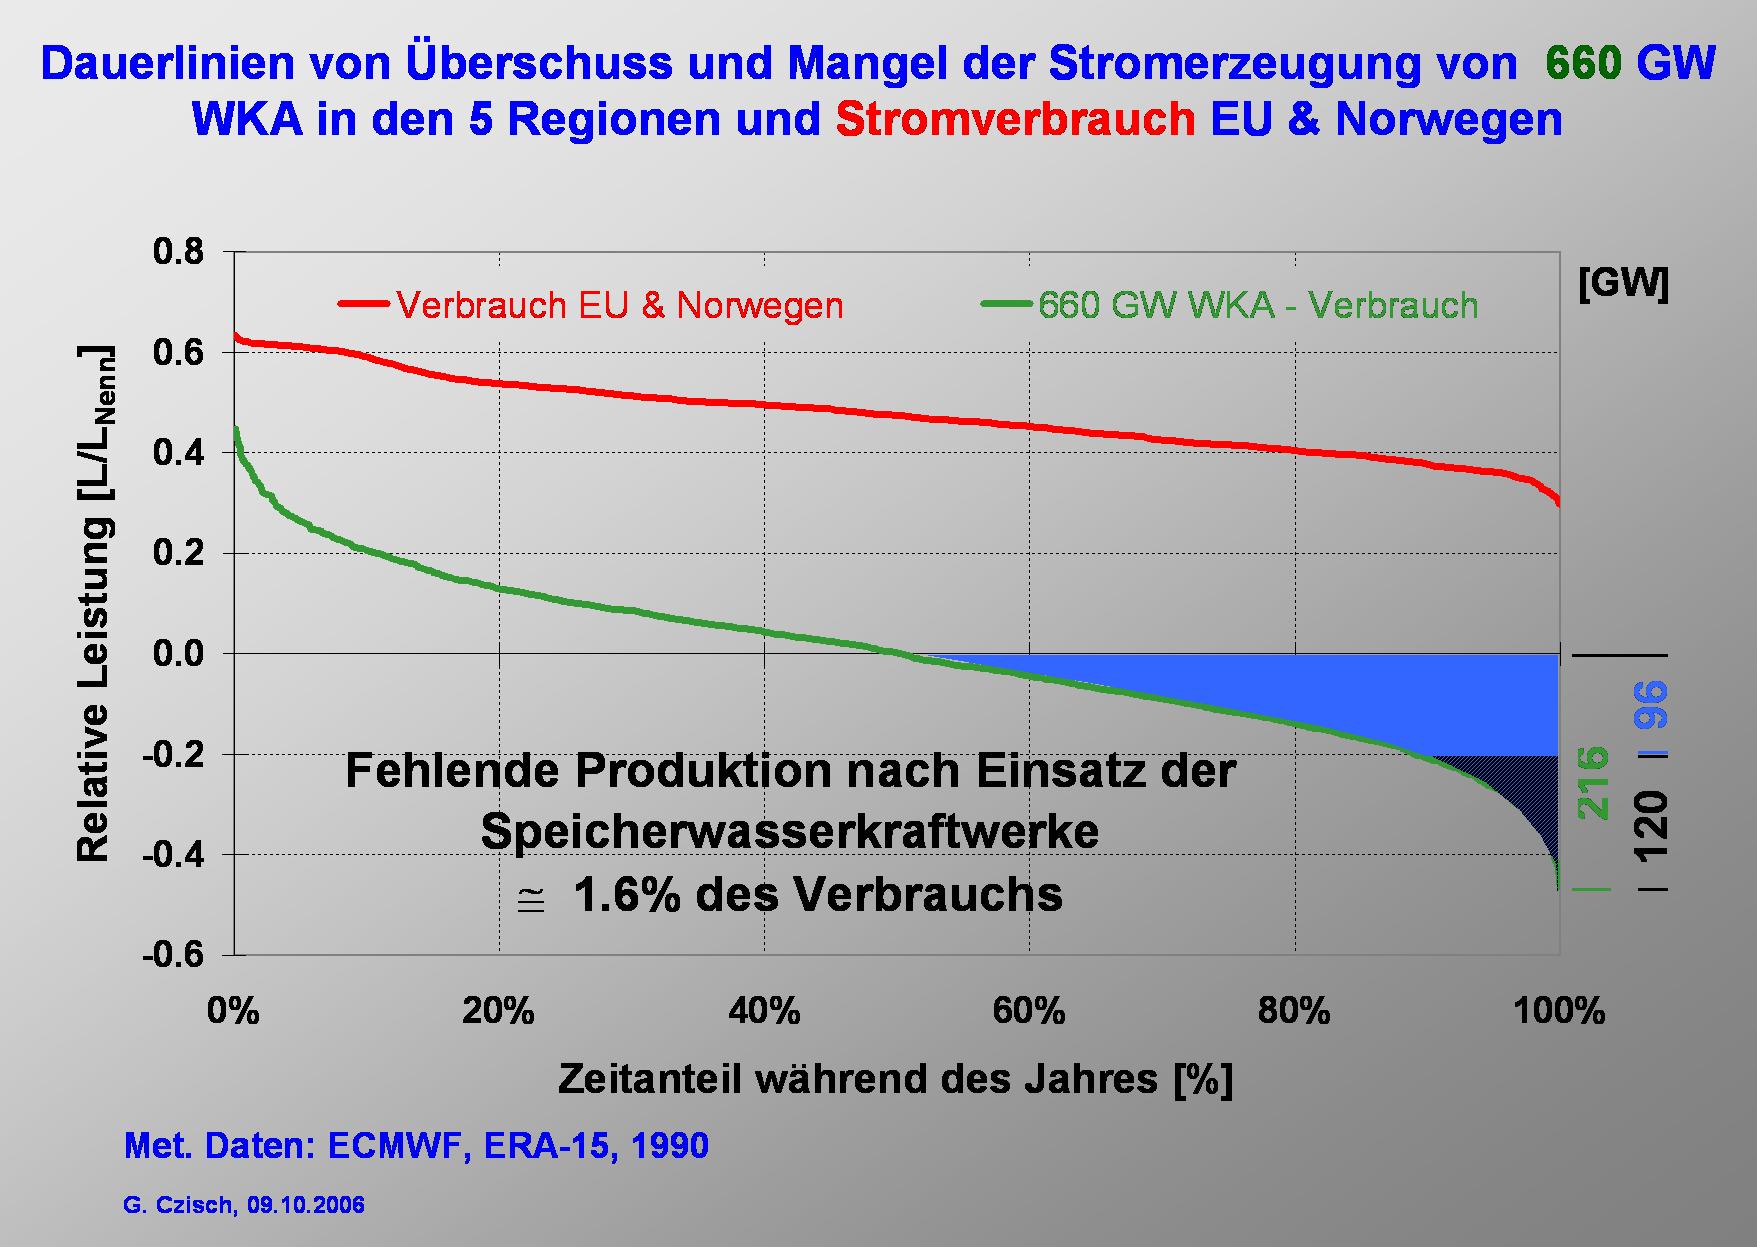
But the 96 GW rated power of the storage hydropower plants is to little to compensate the lack of power. The difference is still 120 GW. |
|
But the missing electrical energy is only a fraction of 1.6% of the total electricity consumption. |
|
There are many possibilities to get the necessary backup power. One is to enlarge the rated power at the hydro power reservoirs as it today sometimes is done to provide peak load capacity. Another way is to use thermal units which could also could be fired by Biomass.
In the example shown here the back-up is considered to come from gas turbines. Considering the typical cost range the total investment in the back-up system would only cost 5 to 10% of the expenses for the wind turbines and therefore is clearly of minor economic relevance. |
|
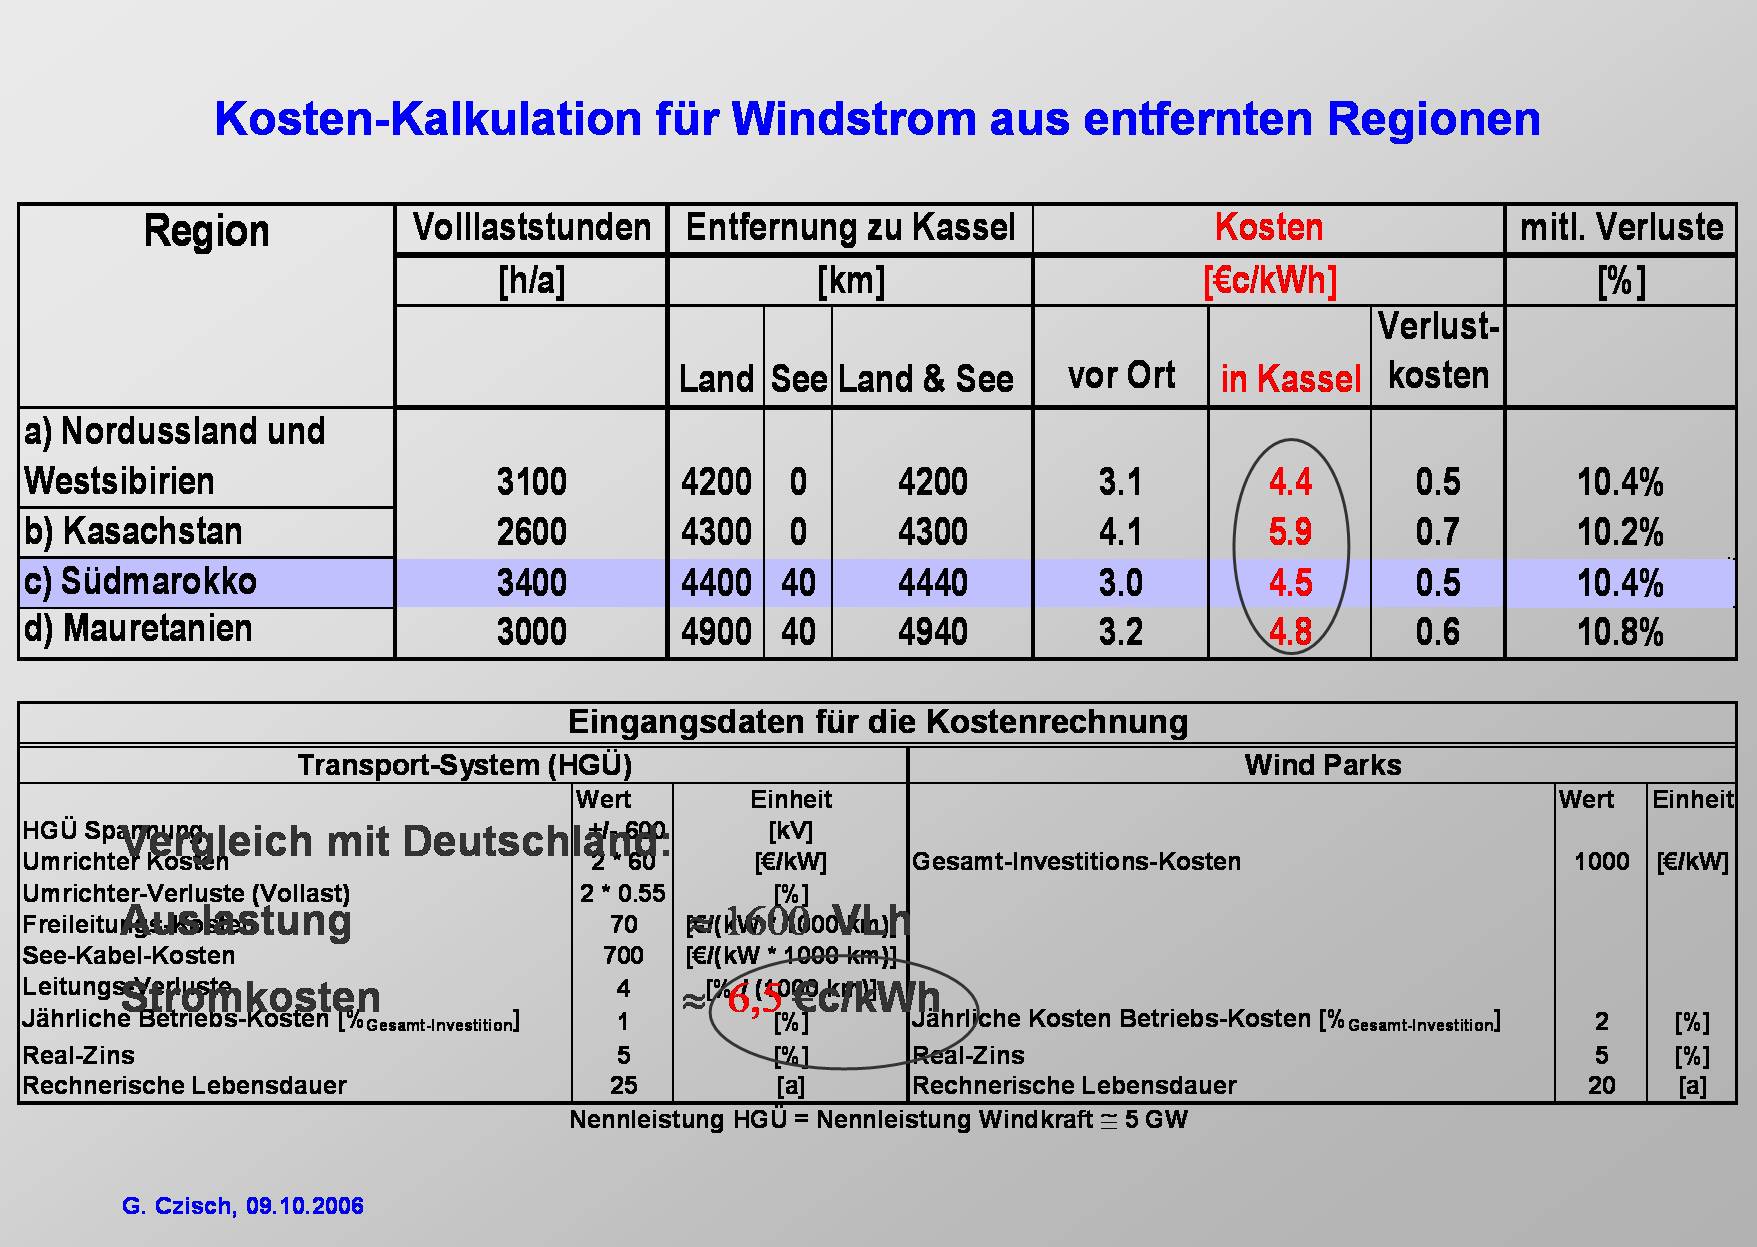
Now some further economic considerations for the example of wind energy use in different regions in and around Europe including the costs and losses for electricity transmission. |
|
Economically the option of wind power import is interesting even if new transport capacity is included.
But not only the low population density and the low costs of imported wind power are notable - as shown – also the temporal behaviour of the power production changes with the size of the catchment area. |

|
Some thoughts about the quality of wind data:
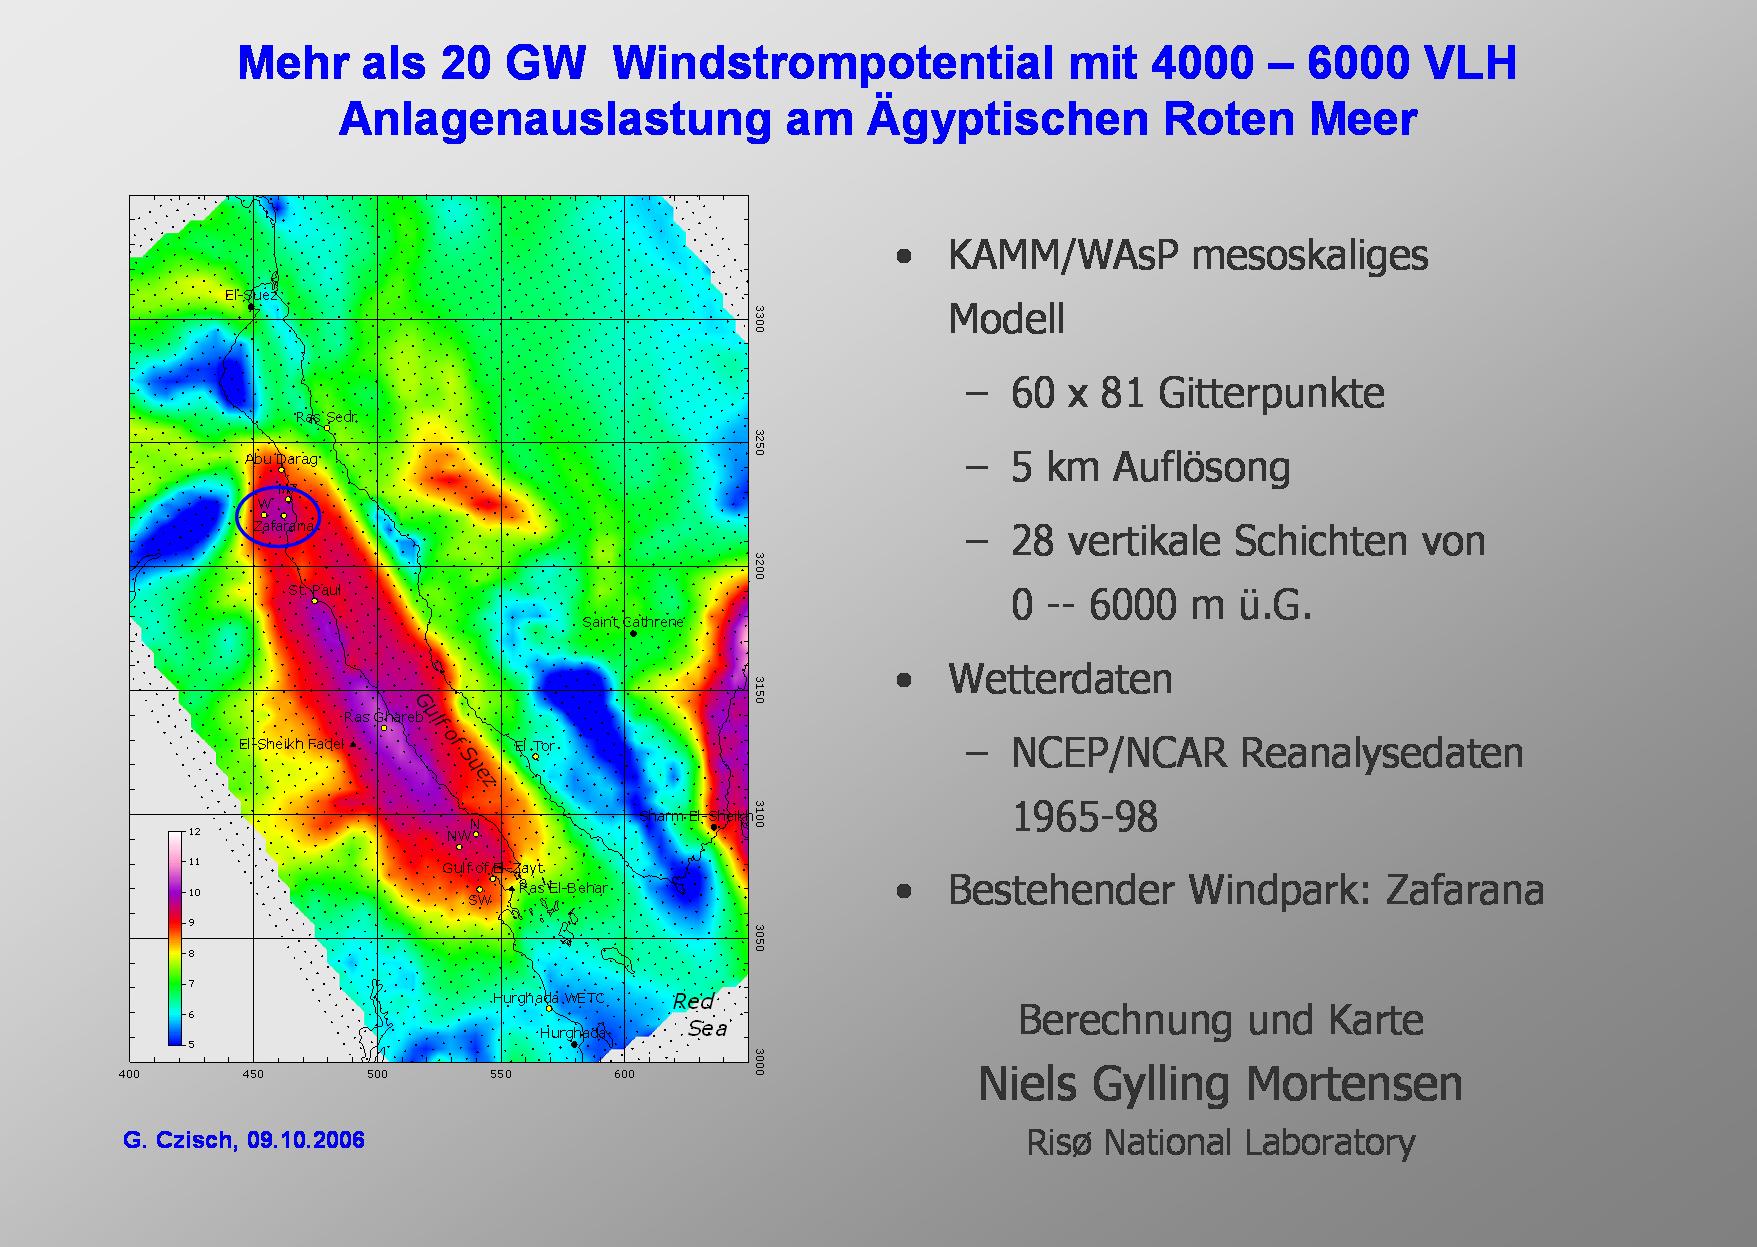
The ECMWF data used for the calculation of wind potentials and also used to provide time series of the potential wind energy production for the scenarios tend to significantly underestimate the conditions in mountainous terrain. This can be shown on a huge variety of locations. One of the most significant underestimations of the wind energy potentials is known in the area around the Gulf of Suez. Here the best locations might deliver almost three times the amount of electricity compared to the calculations based on the ECMWF data. This will be shown in the following slides. The very conservative ECMWF data also lead to very conservative scenarios. This has to be consider while evaluating the results of the scenarios. They therefore tend to be something like a worst case estimation. The real conditions will be better and therefore the electricity might be provided significantly cheaper. |
|
According to calculations of the Risø at the best locations at the Gulf of Suez the average annual wind speed might be higher than 11 m/s.
The blue circle shows an area where wind energy already is used. |
|
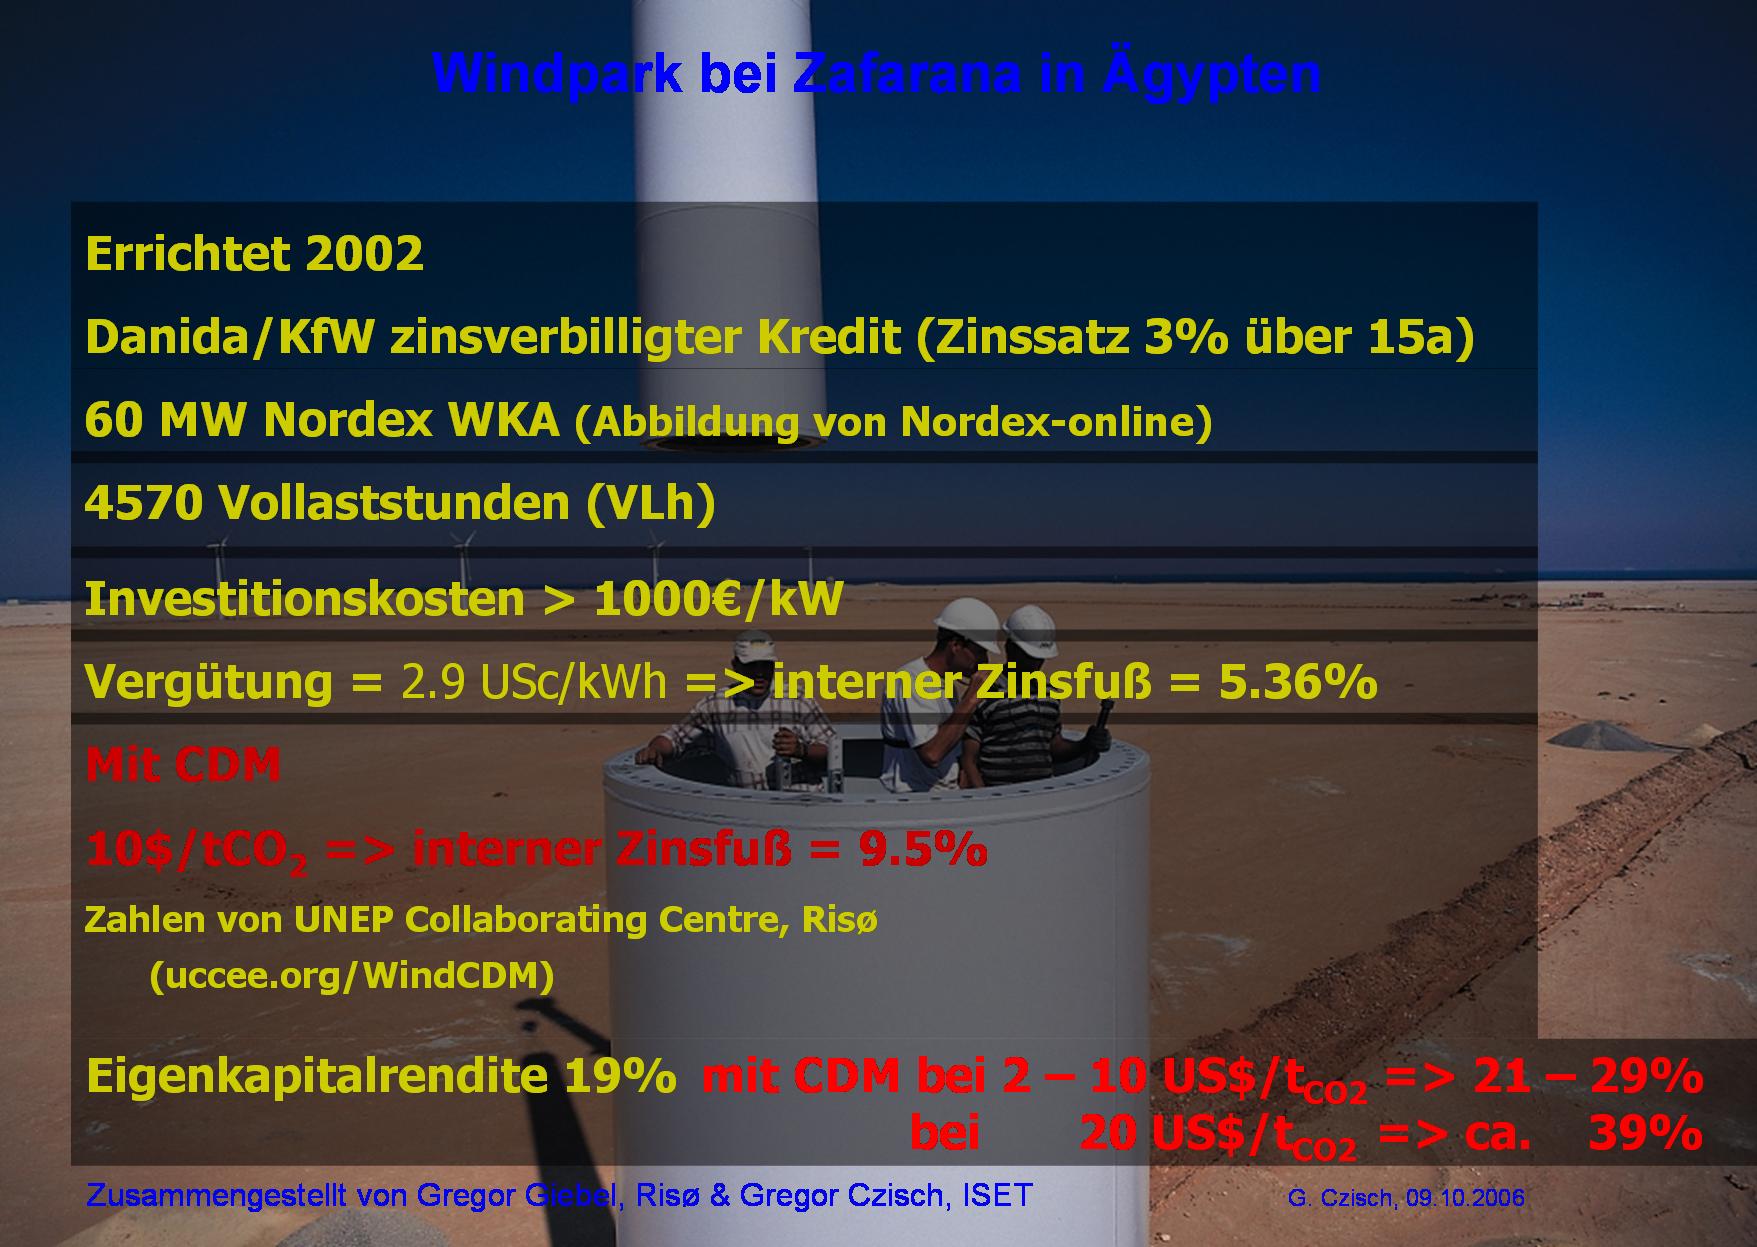
In this area there is a wind park installed which produces electricity at more than 4500 full load hours (FLh = VLh) annually.
It provides the investor a return on equity of 19% at a feed in tariff of 2.9 USct/kWh. |

|
At the best location in this area around the Gulf of Suez windmills might produce electricity at more than 6000 full load hours (FLh = VLh) annually.
Assuming the same credit conditions the same economic output here could be provided to the investor at a feed in tariff of 2.2 USct/kWh. |
|
Scenarios for a future electricity supply
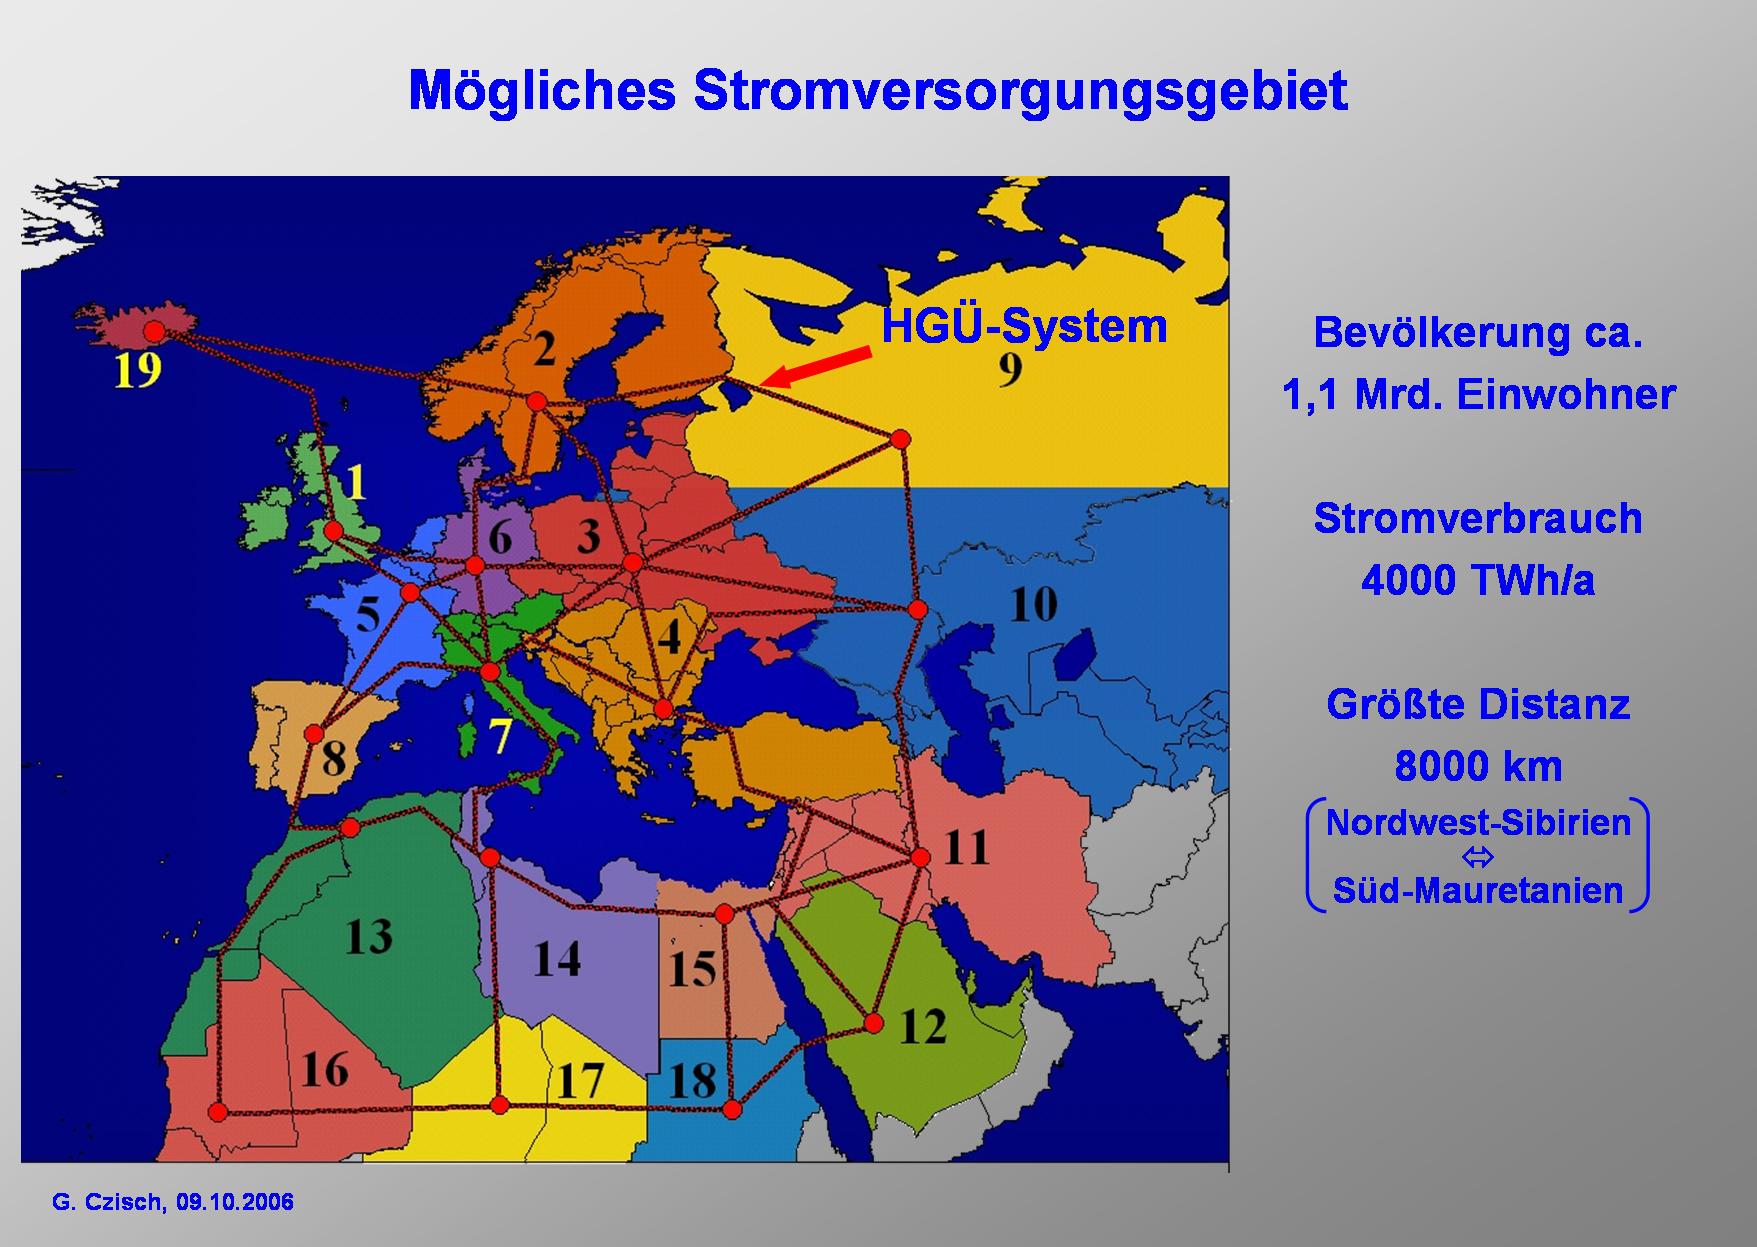
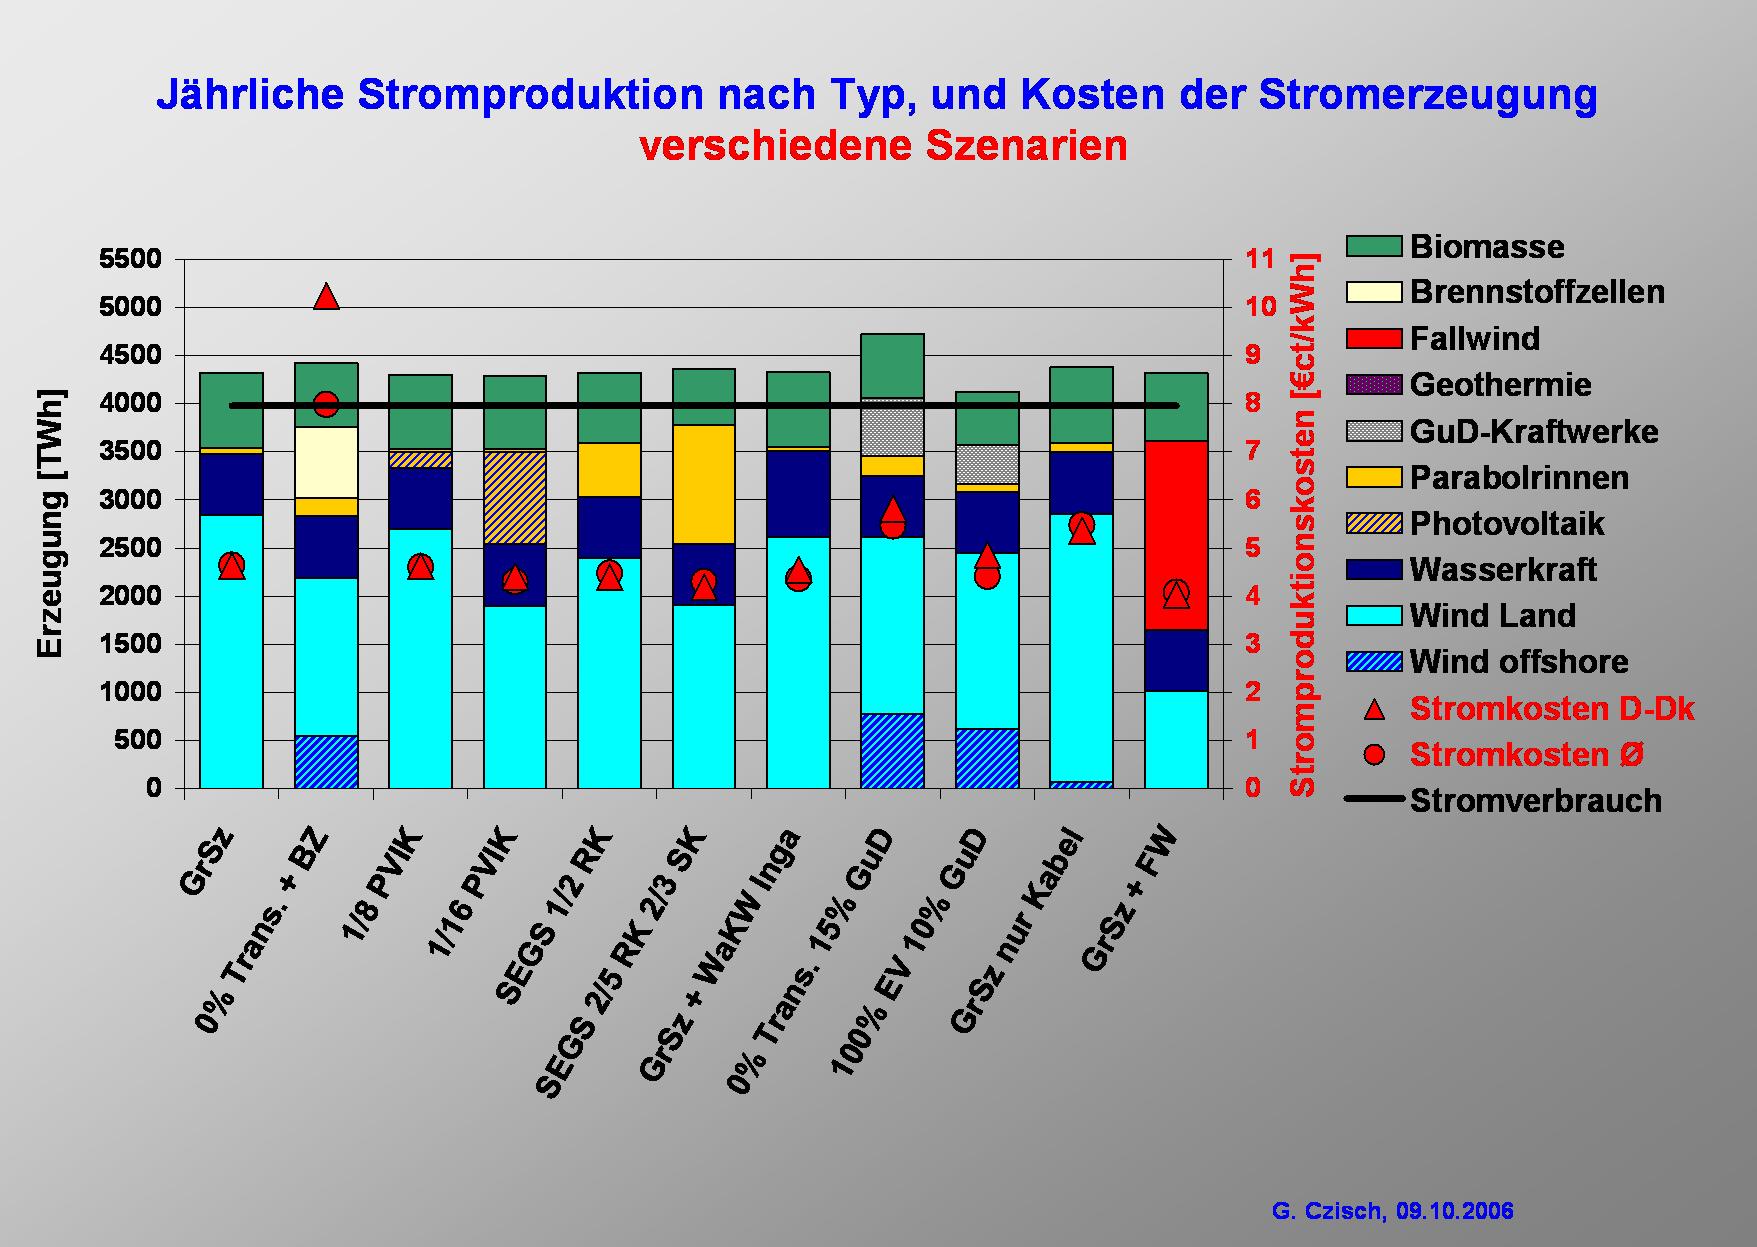
Scenarios for a future electricity supply entirely with renewable energies have been developed for the region shown in this figure. The supply area contains approx. 1.1 billion inhabitants with an electricity consumption of roughly 4000 TWh/a. This part of the world has been analysed to determine the available potentials for a future energy system. Various concepts have been studied for providing renewable energies to Europe and neighbouring regions. This process has taken into account ECMWF data as the meteorological basis and the population density as a restrictive factor for the wind energy potentials or estimated roof areas in all countries within the shown regions for determining the roof top photovoltaic potentials, combined with data on solar irradiation, wind speeds, and also temperatures used e.g. for photovoltaic electricity production and for solar thermal electricity production. Also other renewable resources such as biomass, geothermal potentials and hydropower have been investigated or included at the level of current knowledge. Mathematical optimisation routines have been applied to the question of which renewable resources with their individual temporal behaviour at different sites and with different yields should be used, and how selection should be made to achieve optimum cost performance. (A linear optimisation with roughly 2.45 million restrictions and about 2.2 million free variables was employed to find the best combination in each scenario.). The optimisation takes into account the temporal behaviour of the combined consumption of all countries within every individual region shown here as well as all requirements imposed by resource-constrained production. Both sets of data, electricity demand and temporal behaviour of the possible production, have been compiled for optimisation (using time series with three-hour intervals) for all of the 19 regions to be supplied with electricity. The optimisation process ensures that supply will meet demand at any time, while determining if and to which extent any potential source is to be used, and how every part of the supply system will operate, including the dimensioning and operation of a HVDC grid that is superimposed on the current grid infrastructure. The criterion of optimisation is the minimization of overall annual costs of electricity when fed into the regional high-voltage grids, enabling these costs to be compared directly with those from regular power stations feeding into the conventional AC-high-voltage grid. |
|
Base Case Scenario
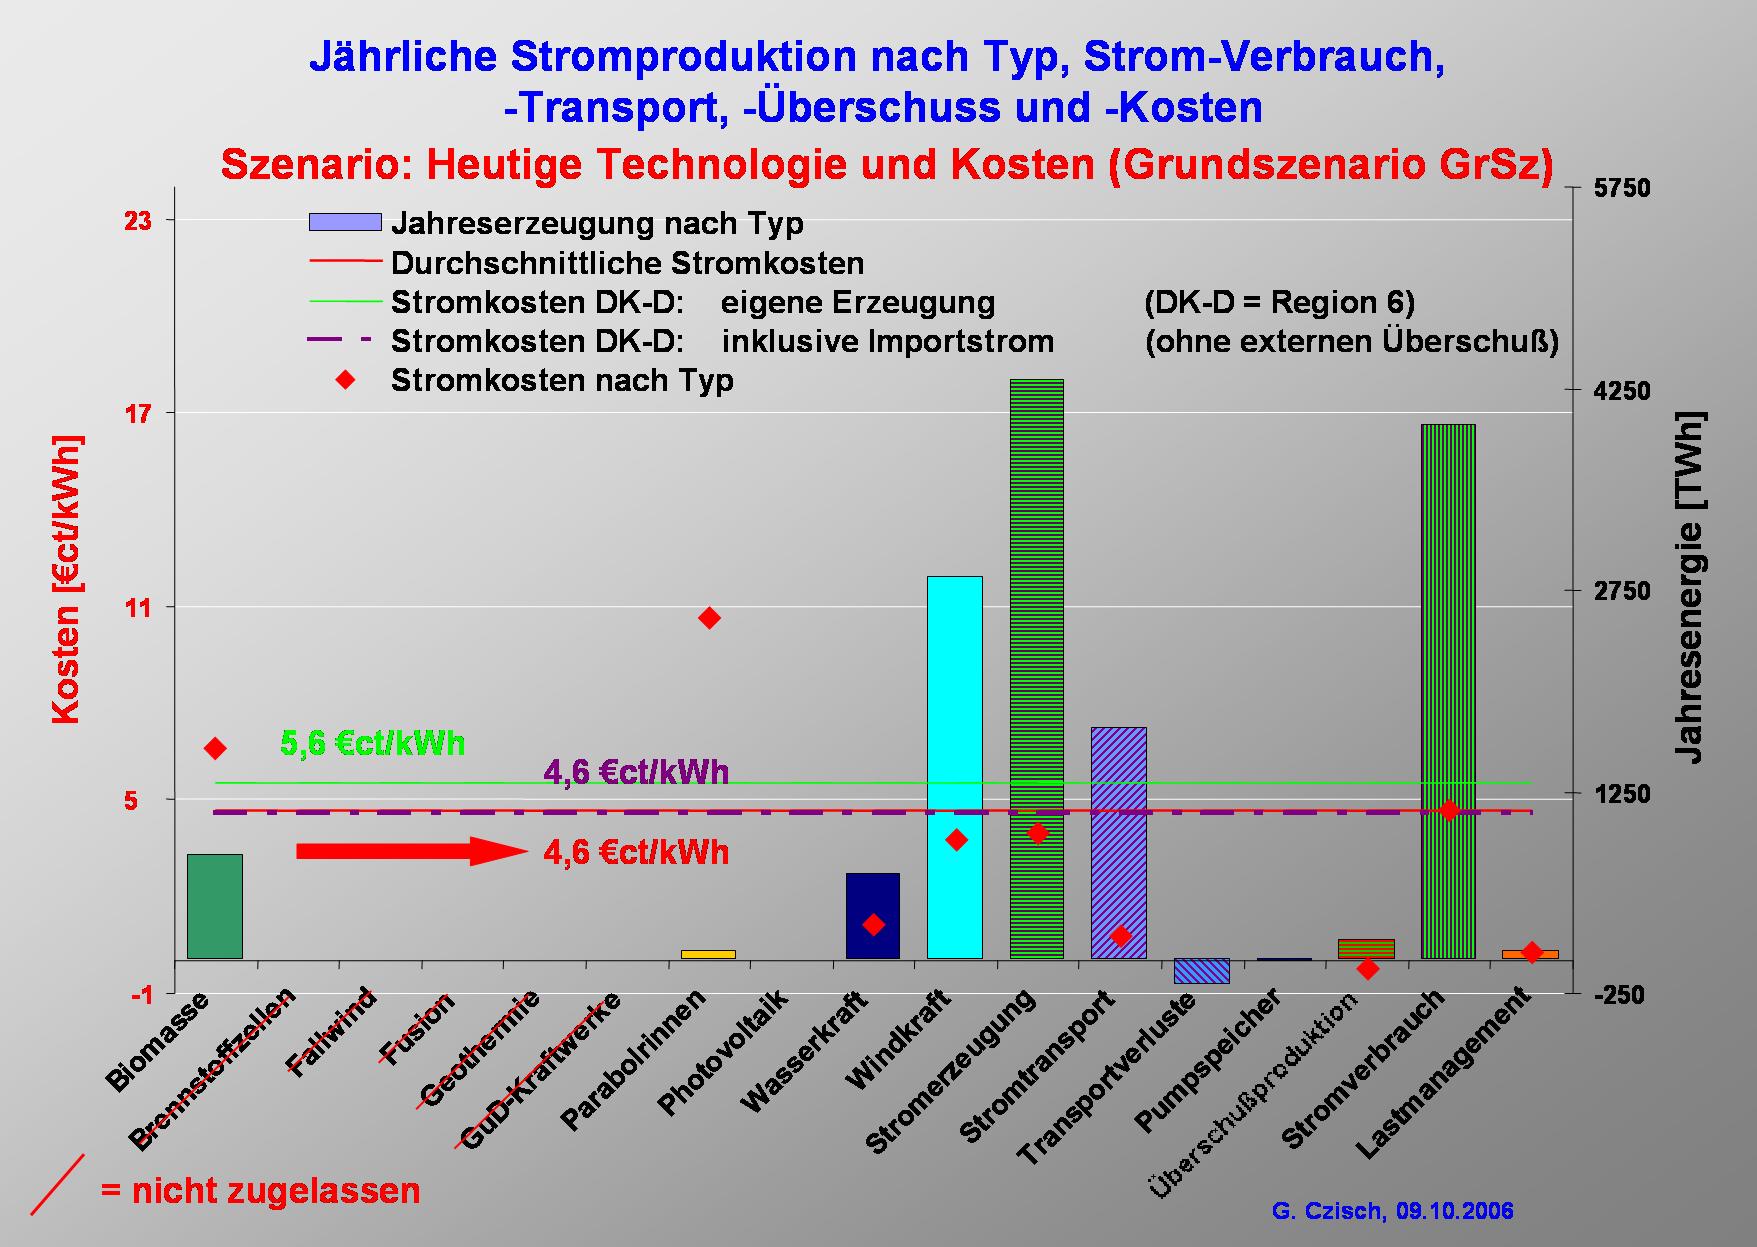
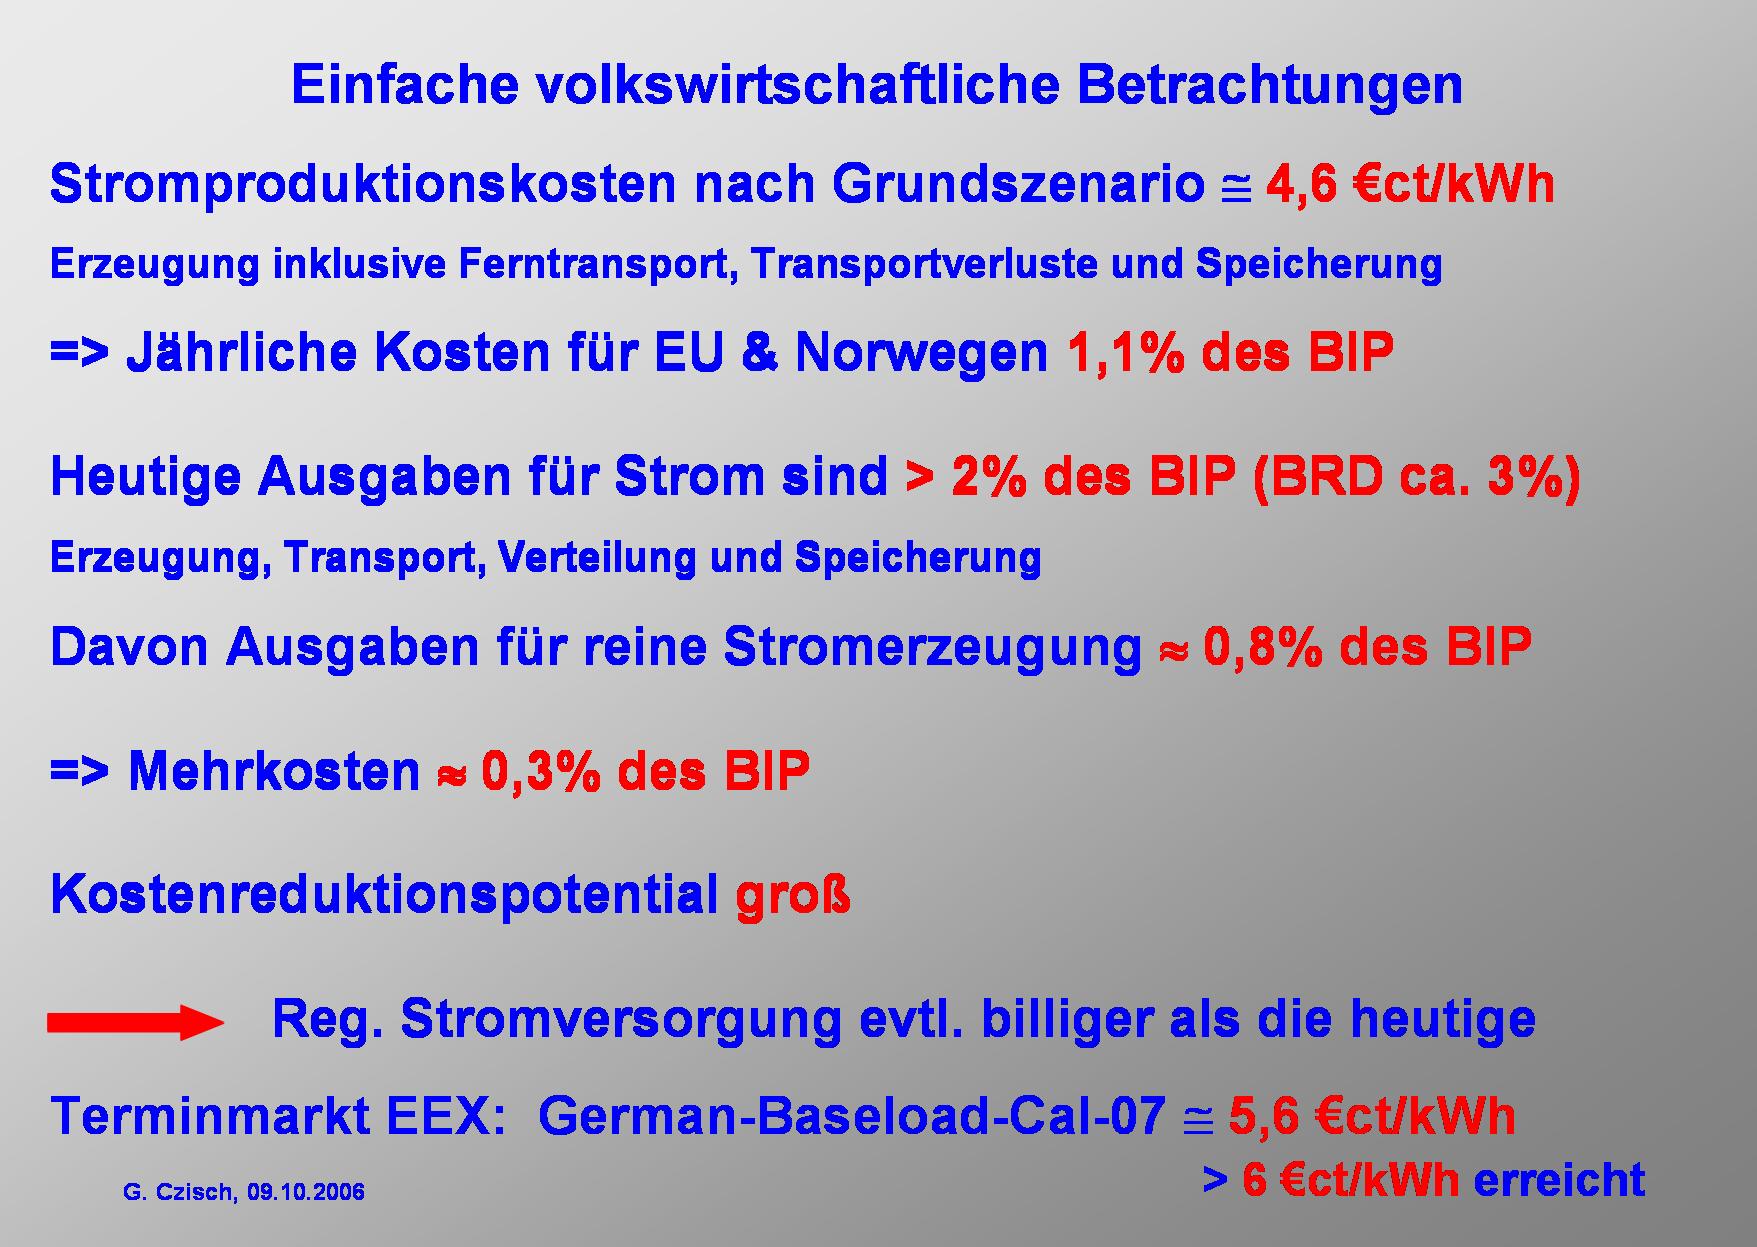
The promising results for the base-case scenario – which assumes an electricity supply system implemented entirely with current technology using only renewable energies at today’s costs for all components for detailed information on underlying assumptions) – indicate that electricity could be produced and transported to the local grids at costs below 4.7 €ct/kWh, which hardly differs from the case of conventional generation today. (At gas prices in 2002 of about 2.4 €ct/kWh for industrial consumers in Germany [EC 04], electricity from newly erected combined-cycle gas power stations had already reached significantly higher 5 - 6 €ct/kWhel. Also the prices for cheap base load electricity e.g. at the EEX are higher than the costs of electricity in the base-case scenario and already reached more than 6 €ct/kWh.) In this scenario, nearly 70% of the power originates from wind energy produced from wind turbines with a rated power of 1040 GW. Biomass and existing hydroelectric power plants provide most of the backup requirements within the supply area, in which the individual regions are strongly interconnected via HVDC transmission lines. Electricity is generated from biomass at 6.6 €ct/kWhel after proceeds from heat sales have been factored in. This result lies significantly above the average price level, yet the backup capability is essential to reduce the overall cost of the entire system. About 42% of the electricity produced is interregionally transmitted via the HVDC-System whereby the total transmission losses sum up to 4.2% of the electricity produced. Another 3.6% loss is production which neither can be consumed at the time it is produced nor be stored for later use within the pumped storage plants and therefore is produced in excess. These two losses may be considered quite acceptable for an electricity supply only using renewable energies. |
|
It can be stated
The costs of electricity don’t have to lie far above today’s costs even if very conservative assumptions are made. At today’s prices for all components, the costs of electricity don’t have to be higher than from a newly erected combined-cycle gas power plant and could be even lower than the current prices of electricity at the cheap base load electricity traded e.g. at the European Energy Exchange. The annual difference in cost compared with the current national bill for electricity, which typically may account for roughly 2 to 3% of the gross national product, would if at all only impose a few per mill of the gross national product as an additional burden on the industrial countries within the supply area of the scenarios, thereby constituting a highly rational alternative to the predictable consequences of climate change and declining fossil fuel resources. Foreseeable cost reductions – particularly for renewable energy technologies – make a comprehensive renewable energy system both conceivable and potentially more economic than all current means of providing electrical energy. However, the costs are dependent on the future system configuration, and could be reduced by ongoing technical progress, or be negatively influenced by wrong energy policies. |
|
Scenario with Transport Restrictions
By contrast to the base case scenario, if interregional transmission is not allowed in a restrictive decentralised scenario, excess production increases significantly to 10% of the production, and additional backup power as well as backup energy employing other resources become necessary within individual isolated regions to meet the demand, leading to great additional expenses. In one scenario, fuel cells powered with renewable hydrogen produce electricity at about 20 €ct/kWhel (which is already quite optimistic if the hydrogen is produced from renewable energies), raising the net electricity costs to over 8 €ct/kWhel on the average. For Region 6 (Germany and Denmark), this restrictive „decentralized” (insular) strategy would lead to costs of electricity greater than 10 €ct/kWh. Scenarios with Reduced Costs for Individual Components The effect of cost changes for individual technologies and components was also investigated in particular scenarios. One aim was to find the costs at which PV could cost-effectively contribute to the supply. Therefore a series of scenarios has been calculated where the PV costs successively have been divided by two. As a result PV has not been chosen by the optimisation until costs have been halved three times. This major cost reduction for PV would enable this technology to provide a significant contribution to the electricity supply. If all other costs remained the same, a reduction to one-eighth of current PV costs would enable an economically viable 4% contribution to overall electricity generation to be provided. The generation would nevertheless be limited to the southernmost regions – particularly to regions 12,16, 17, and 18. If the cost were only one-sixteenth of present levels, PV technologies could account for about 22% of all electricity generation, reducing generation costs compared with the base case scenario by about 10% to 4.3€ct/kWh. Even in this case, however, photovoltaic technologies would not be used in the northern regions 1, 2, 3, 6, 9, and 19, because they could not contribute to overall cost reductions. If the costs of the mirror fields of solar thermal power plants were reduced by half – as is anticipated in the near future – solar thermal power plants would already constitute about 13% of all electricity generation. In this case, the overall electricity costs lie at 4% below those of the base case scenario. Reducing the costs of the collector array to 40% and simultaneously lowering storage costs to two-thirds of current levels (still clearly above achievable storage costs according to the recent research mentioned above) would increase their contribution to 28% of the electricity produced, while the electricity generation costs would – compared to the base case scenario - fall by about 10% to 4.3 €ct/kWh. These examples illustrate that solar thermal generation presents an economically attractive perspective for the future that can be realized fairly easily in view of minimal cost regression factors. Scenario with Hydropower at Inga in the Democratic Republic of Congo The construction of a large hydroelectric power plant at an extremely favourable location in the Democratic Republic of Congo near Inga was also investigated for one proposed scenario (s. also [Kan 99]) The construction of a hydropower plant with a capacity of 38 GW was the decision resulting from computational optimisation. This would lower the costs of electricity by 5.3% compared to the base-case scenario due to more economic generation and incidental system benefits. A primary reason for the low costs of the electricity produced at Inga is the high average load of the hydropower plant of about 6900 FLH and the relatively low anticipated investment costs at this very advantageous site. Two-thirds of the electricity produced at Inga is transmitted over a HVDC system with 26GW capacity, connecting the generating station with Region 17, with the remainder conducted in equal amounts over two HVDC systems with a combined capacity of 12 GW, joining Inga with Regions 16 and 18. Electricity Transmission within the Scenarios In all scenarios – with the exception of restrictive and expensive insular configurations – electricity transmission is of significant importance. The necessary converter capacity (AC DC) for the HVDC grid exceeds values of over 750 GW in some cases. (This level corresponds to about one-half of the installed generation capacity of all production facilities in the scenario regions.) The grid is used to achieve smoothing effects among different resource-dependent generation capacities using renewable energies, and to provide access to hydroelectric plants and to distributed biomass power plants both with associated storage capacity for wide-area backup applications. In the base case scenario, for instance, about 42% of the electricity generated is transmitted over the HVDC system between the regions within the supply area. Measured against the total electricity costs the cost of the transmission system amounts to 7% of which the main part of 5% is contributed by the transmission lines and cables. HVDC transmission has a higher intrinsic system stability than AC lines. Furthermore the transmission system of the base case scenario is highly redundant due to the fact that the thermal limit of the transmission lines is about twice the rated power and due to the fact that between almost all regions two or more systems are designed to be built parallel. But nevertheless if further redundancy was seen as desirable this could be relatively inexpensively achieved. A somewhat extreme idea would be to erect two whole systems of transmission lines in parallel. This would mean that the costs of transmission lines and cables would double but at the same time the losses would decrease and thus the overall cost increase would only be about 3% ensuring a degree of immunity against faults, which is by far higher than stipulated for today’s systems. |

|
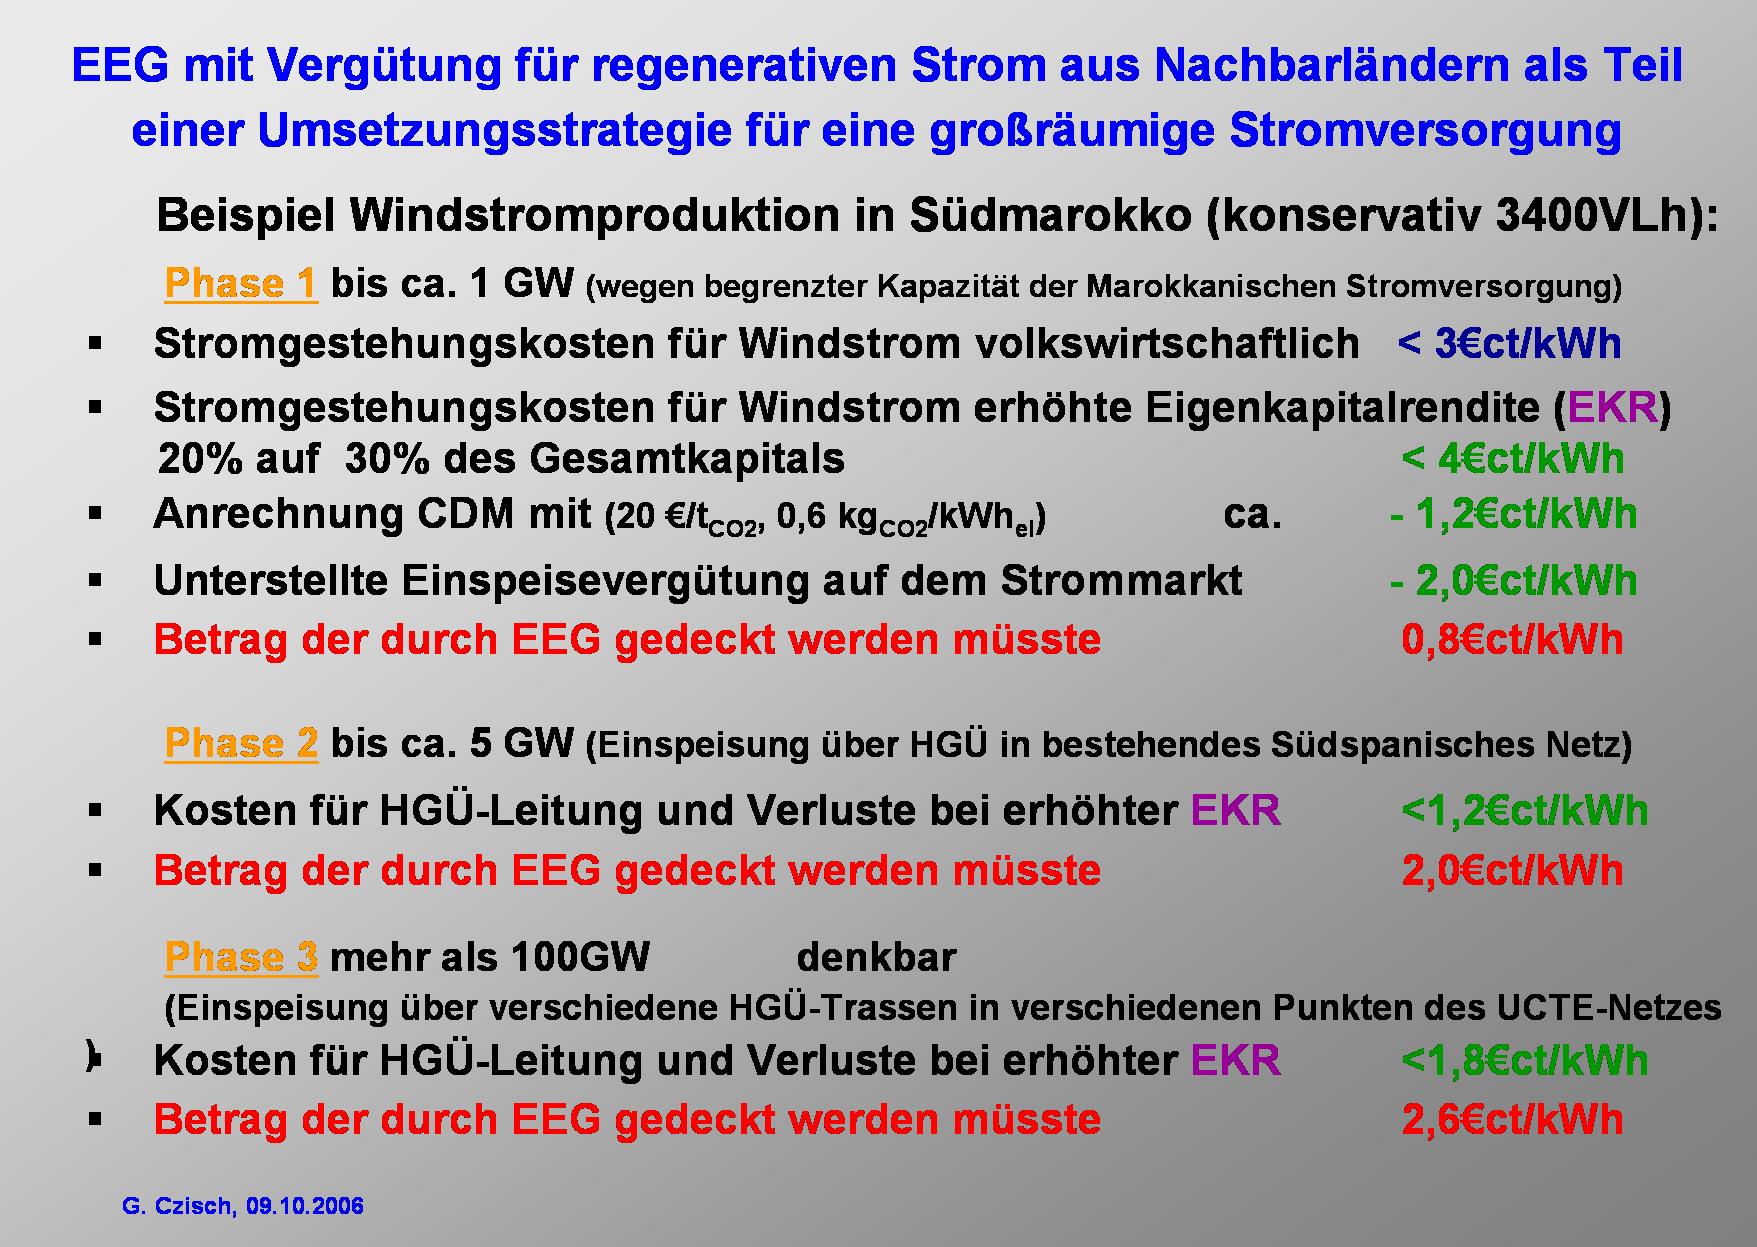
At the end of my talk I want to switch the point of view to an other aspect of the Extraeuropean option for an energy supply with wind power. I roughly want to sketch the idea to combine CO2 reduction and Development aid. Therefore I will compare to potential partners within a new electricity system. Morocco and Germany (data of the late 1990ies): The population of the developing country is about 36% of the German population. In Morocco the electric consumption per capita is 7% of the consumption in Germany. The GDP is just 1.7% of ours. It really is a poor country. In Germany we spend 2.2 % of our GDP on electricity, which is more than the total Moroccan GDP. If the EU decided to produce 10% of its electricity in Morocco (equivalent to 40% of Germany's consumption), the total investment in wind parks is on the one side only 3.3% of Germany's annual GDP or 1 ½ times our annual expenditures for electricity. On the other side it is 2 times the actual GDP of Morocco. So the decision for us would mean to get relatively cheap electricity and for Morocco it could provide development aid that would last for some decades. |
|
Idea for an international instrument to boost the world wide use of wind energy and to provide a new kind of development cooperation
Internationale Förderung der Nutzung erneuerbarer Energien über erweitertes EEG od. ein ähnlich gestaltetes ratifizierbares Abkommen Das Erneuerbare-Energien-Gesetz (EEG), das die Abnahme und die kostendeckende Vergütung von Strom aus erneuerbaren Energien gesetzlich regelt, ist das weltweit wirkungsvollste Förderinstrument zur Nutzung erneuerbarer Energien. Dieses Instrument soll weiterhin als Bestandteil der Energiepolitik eingesetzt und in seiner Wirkung noch verbessert werden. Dazu soll u.a. entweder das EEG selber so erweitert oder ein neues Regelwerk in Anlehnung daran geschaffen werden, dass es den Ausbau erneuerbarer Energien in Form eines internationalen Abkommens fördert, dem sich interessierte Staaten durch Ratifizierung anschließen können, die sich gemeinsam dem Ziel des Ausbaus der Nutzung erneuerbarer Energien und damit langfristig einer Energiewende hin zu einer nachhaltigen Energieversorgung verpflichten wollen. Die Finanzierung der Stromkosten soll – wie beim heutigen EEG – anteilig entsprechend des jeweiligen Stromverbrauchs der Endkunden verteilt werden. Abweichend vom deutschen EEG sollen – wie bei der spanischen Regelung – nur die Mehrkosten umgelegt werde, die über der - mit jedem Land zu vereinbarenden - Grundvergütung liegen. (siehe Beispiel Marokko) Weitere Ausführungen: Ein möglicher Ansatz, das EEG zu erweitern oder ein entsprechendes international wirksames Instrument zu schaffen sollte sowohl die Vergütung erneuerbare Energie vorsehen, die im Ausland zur Stromversorgung gewonnen und verbraucht wird, als auch Energie, die im Ausland gewonnen und von dort aus in Drittstaaten oder zu uns transportiert wird. Damit kann gewährleistet werden, dass große günstige Potentiale erneuerbarer Energien auch in Ländern genutzt werden können, die selber einen geringen Energieverbrauch haben oder wirtschaftlich nicht dazu in der Lage sind. So kann die Nutzung dieser Potentiale in den Dienst der -- nur als internationale Aufgabe aufzufassenden -- Klima- und Ressourcenpolitik gestellt werden. Diese Form von EEG kann dabei entweder bilateral zwischen Deutschland und anderen Staaten, Europäisch oder am sinnvollsten zur internationalen Ratifizierung angelegt sein, wobei insbesondere auch eine Verankerung in der UNO sinnvoll erscheint. Die Vergütung erneuerbarer Energie im Ausland, kann als Einstieg gesehen werden, der den zweiten Schritt des Exports vorbereitet. Ein derartiges internationales EEG könnte zu einer Art Entwicklungshilfe für Nachbarstaaten im Süden und Osten der EU werden, die gleichzeitig – durch die Nutzung kostengünstiger Potentiale - auch von wirtschaftlichem Vorteil für die reichen "Geberländer" wäre. Ein wesentlicher Effekt eines internationalen EEG sollte auch darin liegen, besonders günstige Standorte für verschiedene erneuerbare Energien zu erschließen, um so auch kostengünstigere Lösungen für einen möglichst schnellen Ausbau und damit verbundenen Ressourcen- und Klimaschutz zu gelangen, als dies bei nationalen Alleingängen zu erreichen wäre. Eine internationale Kooperation im Bereich der Stromproduktion eröffnet die Möglichkeit einer nachhaltigen Stromversorgung allein aus erneuerbaren Energien und würde sich selbst bei Verwendung nur heute schon marktverfügbarer Techniken zu heutigen Preisen nur geringfügig auf die Stromkosten auswirken. Bei annähernd optimaler Nutzung der erneuerbaren Ressourcen und verfügbaren Techniken wären selbst ohne weitere technisch/wirtschaftliche Fortschritte Kosten für Strom aus Erneuerbaren Energien erreichbar, die unter den Preisen vergleichbaren Stroms an der Strombörse liegen oder z.B. unter den Kosten von Strom aus neu gebauten Gaskraftwerken. Damit könnte eine Umstellung auf Erneuerbaren Energien sogar zu volkswirtschaftlichen Entlastungen führen, die durch weitere technisch/wirtschaftliche Fortschritte bei der regenerativen Stromerzeugung größer werden. Hintergrundinformation: Untersuchung zur internationalen Kooperation im Bereich der Stromproduktion Interkontinentale Vernetzung regenerativer Energien http://www.bine.info/magazin_folgeseite.php?id_thema=12&id=31 Szenarien zur zukünftigen Stromversorgung - Kostenoptimierte Variationen zur Versorgung Europas und seiner Nachbarn mit Strom aus erneuerbaren Energien https://kobra.bibliothek.uni-kassel.de/handle/urn:nbn:de:hebis:34-200604119596 |

|
It is high time to act!
There is no technical or economic problem which must prevent us from changing our electricity supply to one that is based 100%b on renewable energies! |