
Vortrag Lübeck 2006 - Folie 20: Unterschied zwischen den Versionen
Aus Transnational-Renewables
(Die Seite wurde neu angelegt: „{{Slide|LB2006-slide|de|20}}“) |
|||
| Zeile 1: | Zeile 1: | ||
{{Slide|LB2006-slide|de|20}} | {{Slide|LB2006-slide|de|20}} | ||
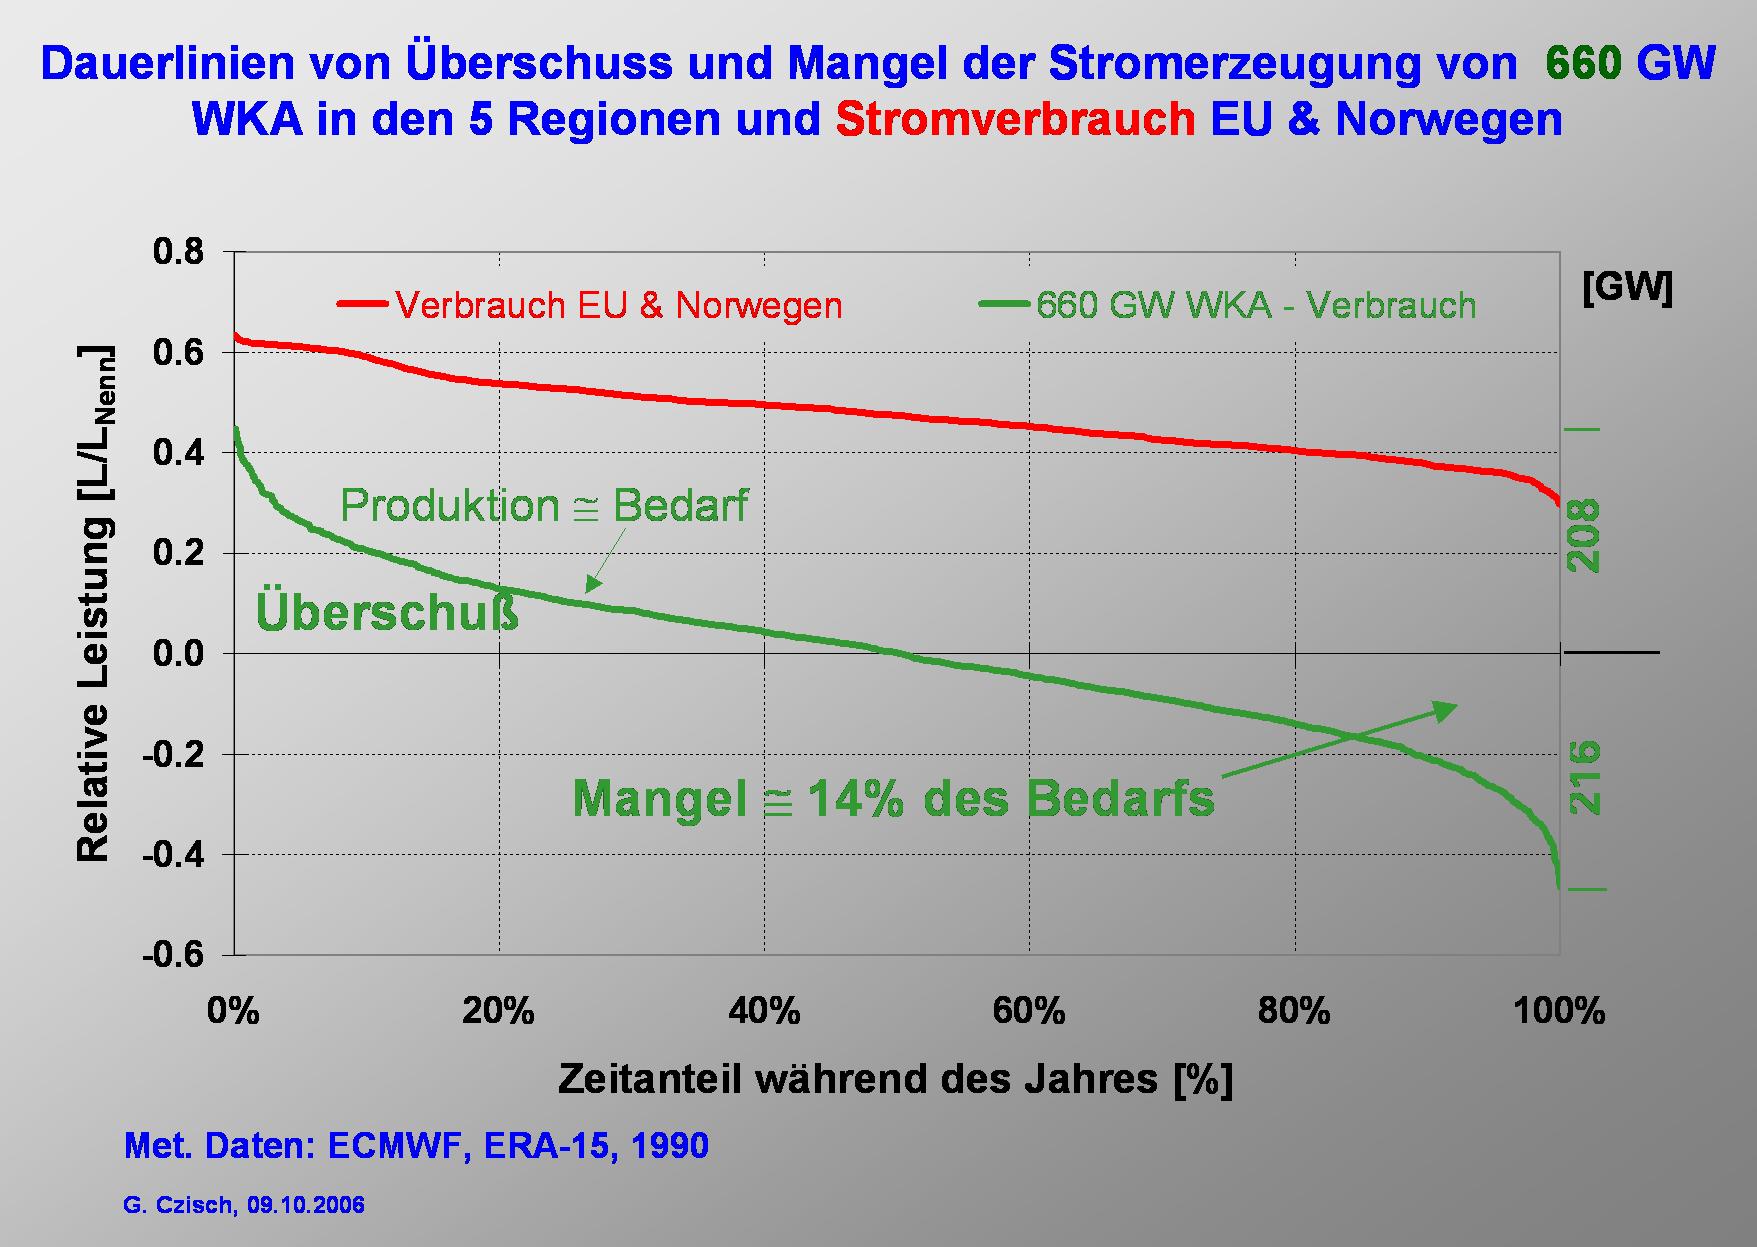
| + | Following this simple example I would like to illustrate the influence of a combined production of electricity at the selected 5 regions shown before. | ||
| + | |||
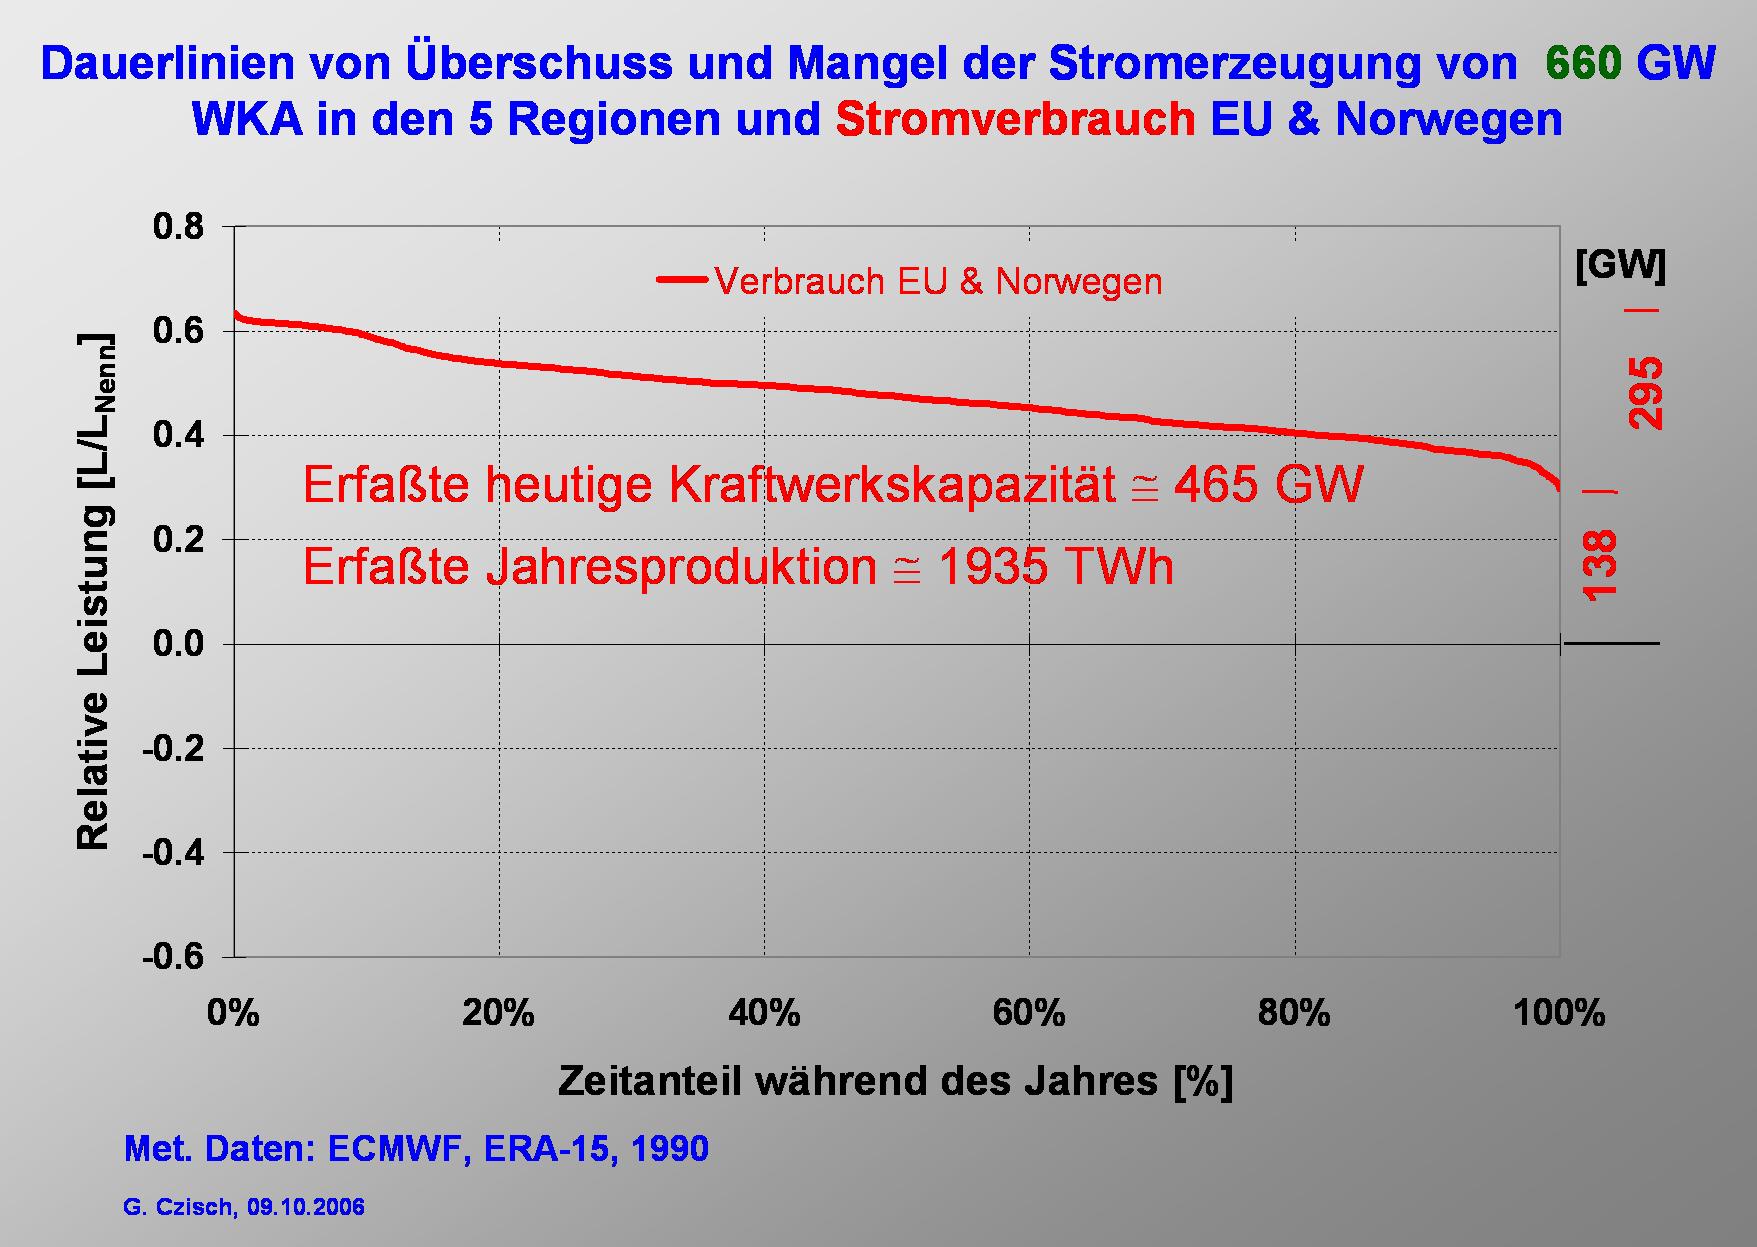
| + | The duration curve of the hourly electricity consumption depicted in the slide represents a total rated power of 465 GW and a demand of 1940 TWh. The maximum power demand is 295 GW, the minimum about 140 GW. | ||
Aktuelle Version vom 3. Oktober 2010, 12:28 Uhr
| Lecture Magdeburg [2001,en], Vortrag Lübeck [2006,de], Lecture Barcelona [2008,en], Vortrag EWEA 2000 [2000,en] |
| Vorstellung regenerativer Energien: Biomasse, Windenergie, Fallwindkraftwerke, Geothermie, Wasserkraft, Solarenergie |
|
Übersicht
|
|
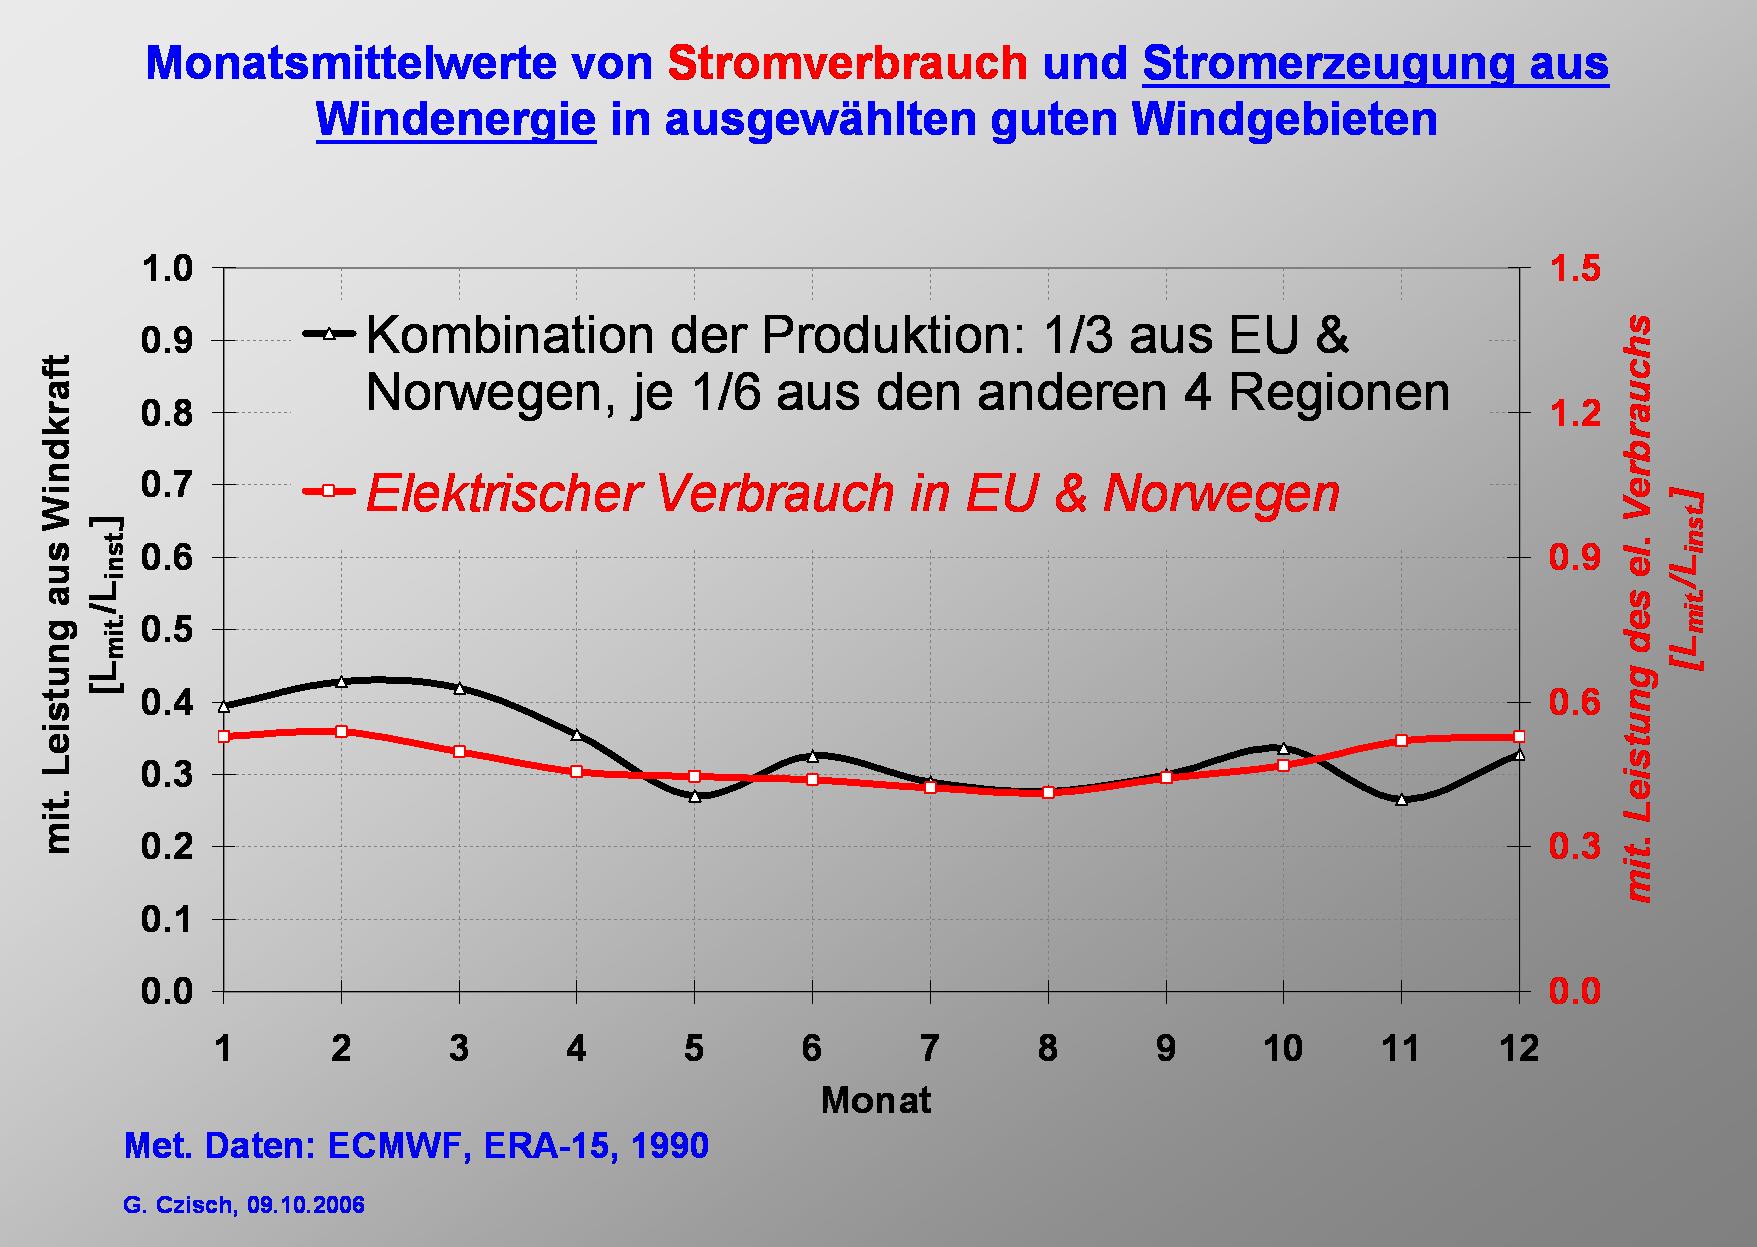
Following this simple example I would like to illustrate the influence of a combined production of electricity at the selected 5 regions shown before.
The duration curve of the hourly electricity consumption depicted in the slide represents a total rated power of 465 GW and a demand of 1940 TWh. The maximum power demand is 295 GW, the minimum about 140 GW.