
Lecture EWEA 2000 - Slide 25
Aus Transnational-Renewables
| Lecture Magdeburg [2001,en], Vortrag Lübeck [2006,de], Lecture Barcelona [2008,en], Vortrag EWEA 2000 [2000,en] |
| Vorstellung regenerativer Energien: Biomasse, Windenergie, Fallwindkraftwerke, Geothermie, Wasserkraft, Solarenergie |
|
Overview
|

|
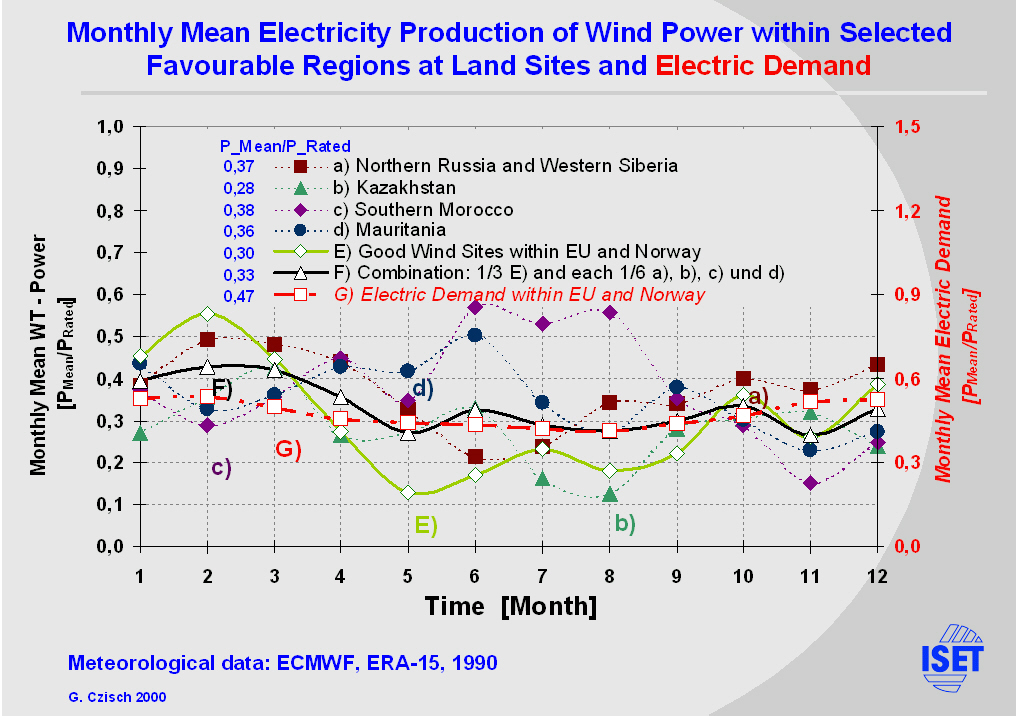
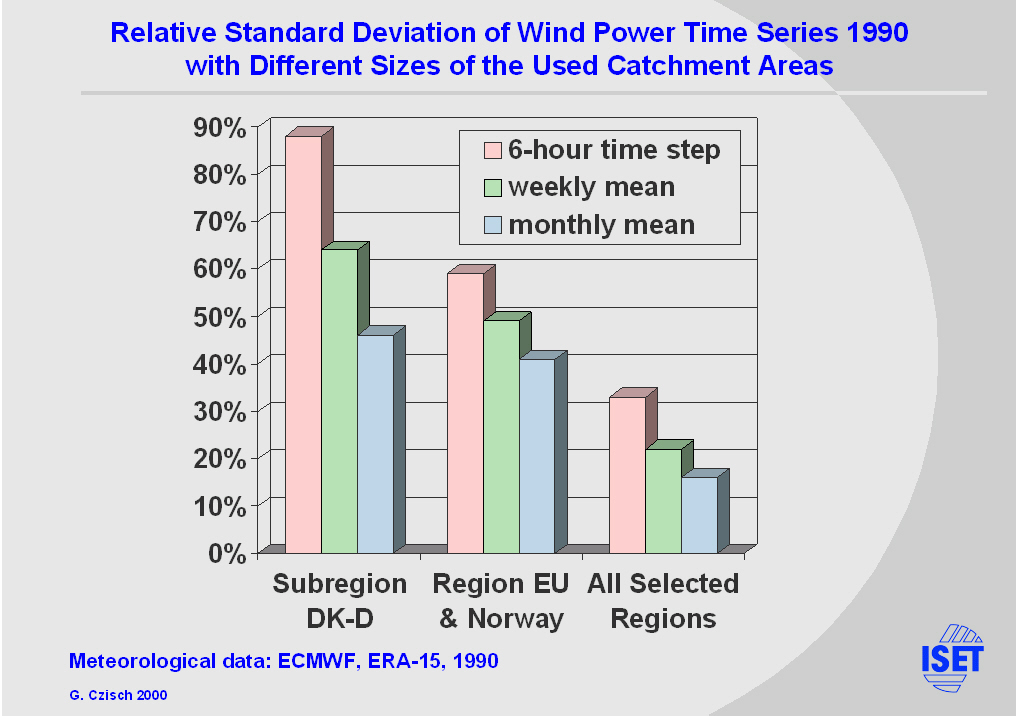
The change of the temporal behaviour of wind power production from different catchment areas can bee seen comparing its weighted standard deviations (STD/mean production). Here the results are shown for three different averaging times and three areas. The smallest only includes good wind sites in Germany and Denmark (DK-D). In general the fluctuations rapidly decline with the size of the catchment area (see also REFERENCES[8] in the text version). For the simultaneous use of all regions mentioned the relative standard deviations are for all averaging times close to 30% of those within the area DK-D. The production is much smoother and the need of fast reactions to changes as well as of storage systems is significantly lower.